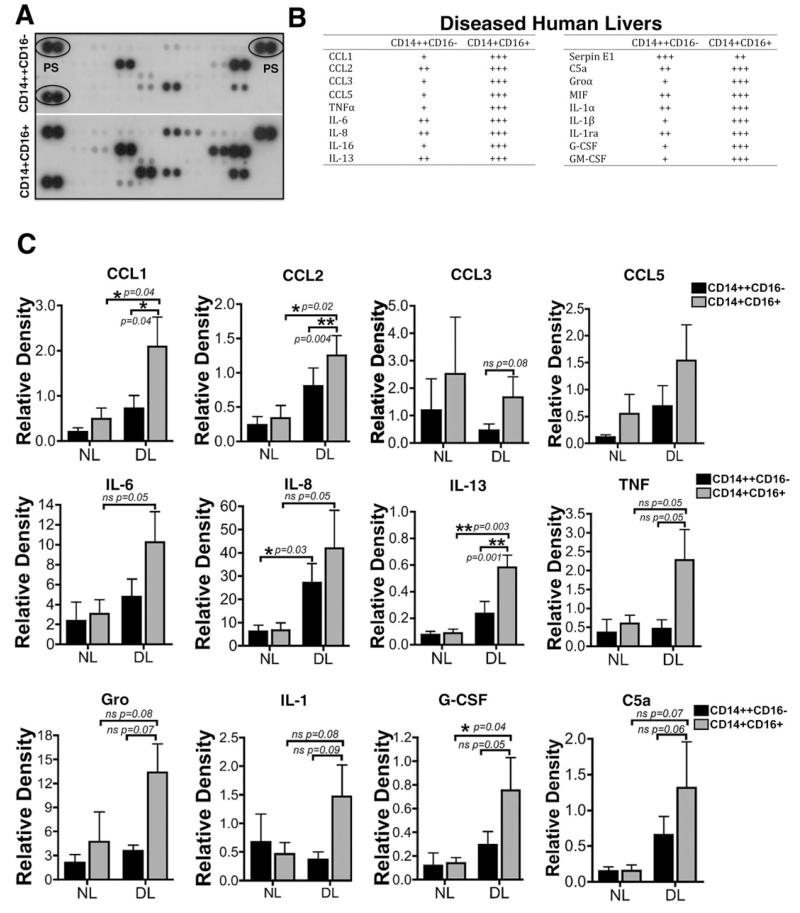
Fig. 8. Monocyte cytokine secretion analysis.
CD14++CD16− and CD14+CD16+ monocytes isolated from nondiseased livers (n = 3) and diseased livers (ALD, n = 2; PSC, n = 1) were cultured for 48 hours prior to collection of conditioned media and analysis of cytokine secretion. (A) Representative dot plot image of cytokine array analysis showing the expression of different cytokines from CD14++CD16− and CD14+CD16+ monocytes. PS, positive control. (B) Table shows the levels of cytokines secreted by diseased livers infiltrating CD14++CD16− and CD14+CD16+ monocytes. (C) Cytokines released by nondiseased and diseased liver-infiltrating monocytes relative to positive controls, all normalized to 106 cells. *P < 0.05, **P < 0.01, ***P < 0.001 (paired Student t test).

