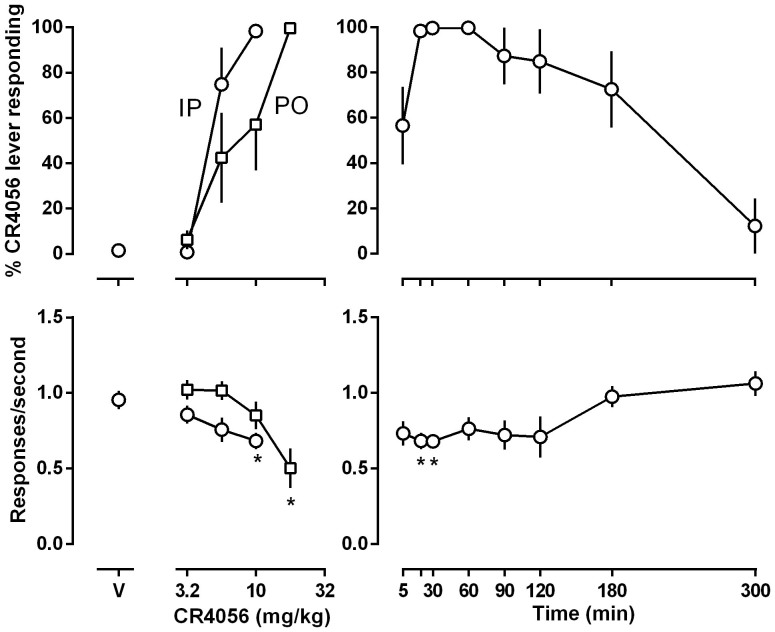
Figure 1. Effects of CR4056 in rats trained to discriminate between 10 mg/kg CR4056 (i.p) and vehicle using a two-lever food-reinforced procedure.
The mean (±1 SEM) percentage of responses on the CR4056-appropriate lever (top panels) and the mean (±1 SEM) rate of responding (bottom panels) are plotted as a function of dose in the left panels and as a function of time after i.p. administration of 10 mg/kg CR4056 in the right panels. Points above “V” indicate vehicle. Each point represents the average (±S.E.M.) of eight rats. Asterisks indicate mean rate of responding that were significantly different from control (95% CLs did not overlap).

