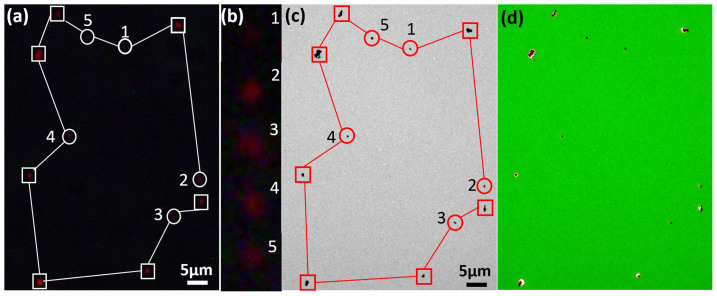
Figure 4. Imaging results of the Y2O2S:Eu nanoparticles.
(a) A time-gated image shows a pattern of luminescence spots. The spots marked with circles (numbered as 1 to 5) contain single Eu nanoparticles, while the others marked with squares contain aggregation of nanoparticles. (b) The enlarged images are given for spots 1–5. (c) The TEM image shows the same pattern for the spots of nanoparticles. (d) Co-localisation analysis confirms the perfect match between the time-gated image and the TEM image.

