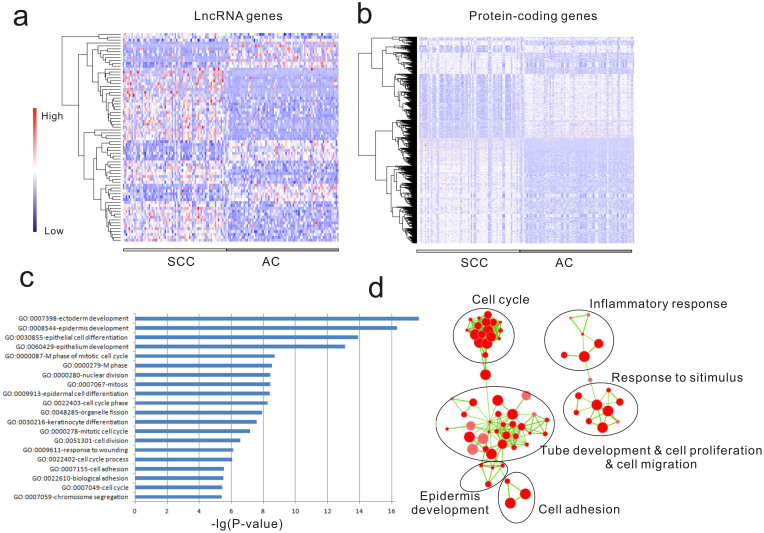
Figure 1. Expression profile and functional enrichment of cancer subtype associated genes.
(a) and (b) denote the expression profiles of lncRNA and protein-coding genes respectively. SCC: squamous cell carcinoma; AC: adenocarcinoma; (c) The functional enrichment results of differentially expressed protein-coding genes. (d) The functional enrichment map of GO terms with each node represents an GO term and an edge represents existing genes shared between connecting GO terms. Node size denotes the number of gene in the GO term. The main functional processes are marked for each group of GO terms.

