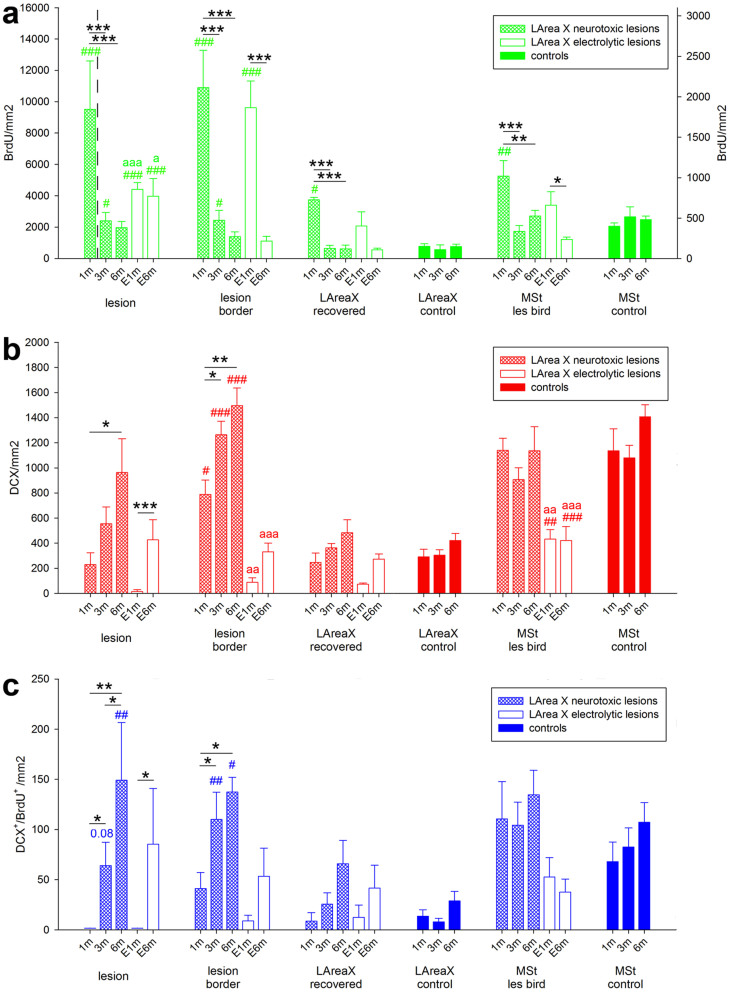
Figure 10. Quantification of lesion induced and spontaneous neurogenesis in LArea X lesioned and control birds, respectively, at 1, 3 and 6 months after surgery.
Graphs show on the y-axis the number of (a), new cells (BrdU+), (b), young neurons (DCX+), and (c), new young neurons (DCX+/BrdU+) that arose 1 month before sacrifice. There are two y-axes in a; the left one is for the first bar and the right one is for all the other bars. The two parts of the graph are also divided by the black vertical dashed line. The x-axis in all graphs shows designated brain regions for cell counts and survival times in neurotoxically (1, 3, and 6 months) and electrolytically (E 1 and 6 months) lesioned and sham control birds. Values are means ± SEM. * statistical significance for comparison among the time points for a given area; # statistical significance for comparison of lesioned and control birds at the given time point; “a” statistical significance for comparison of neurotoxically and electrolytically lesioned birds at the given time point. * and # p < 0.05; **, ## and aa p < 0.01; ***, ### and aaa p < 0.001 (ANOVA followed by Fisher’s PLSD post hoc test).

