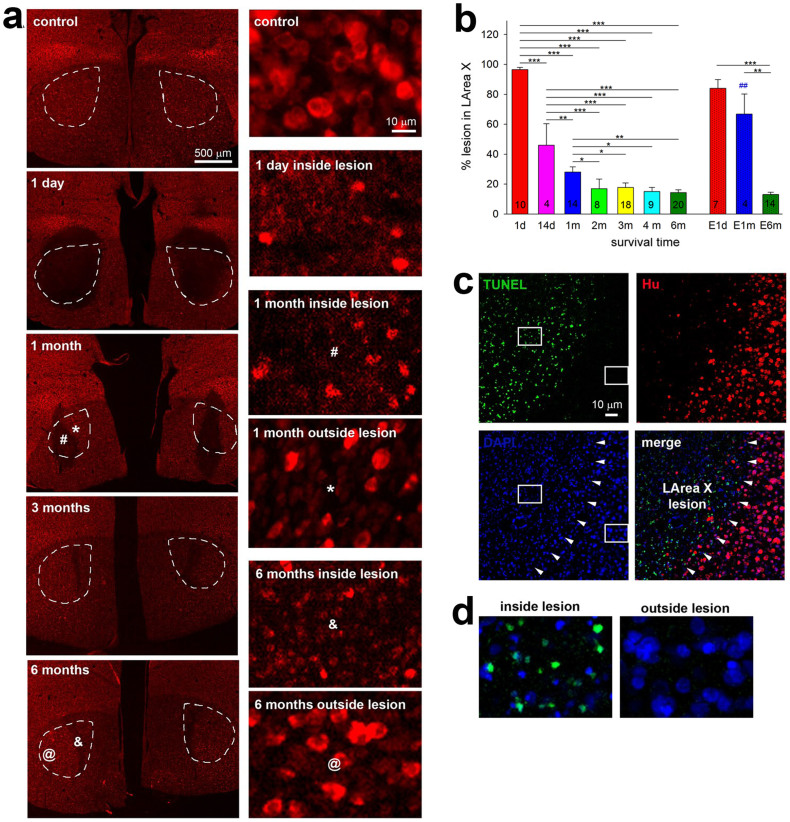
Figure 6. Lesion in LArea X.
(a), Example photomicrographs of coronal sections showing both hemispheres in a control bird and in birds 1 day and 1, 3 and 6 months after bilateral LArea X neurotoxic lesions. Neurons are visualized by red Hu-immunofluorescence. Left panels, low magnification images with LArea X indicated by dashed lines; note recovery as well as presence of lesioned tissue even by 6 months. Right panels, higher magnification images of control, lesioned, or recovered parts of LArea X; the symbols inside LArea X depict the locations in the right panels. Note the difference in size of the neurons and quality of tissue inside and outside the lesion area. (b), Quantification of lesion size in LArea X measured as % lesioned relative to the average LArea X size in sham control birds; n represents the number of hemispheres. First 7 bars, neurotoxic lesions; last 3 bars, electrolytic lesions. Values are means ± SEM. * p < 0.05; ** p < 0.01; *** p < 0.001 (ANOVA followed by Fisher’s PLSD post hoc test). ## is p<0.01 for comparison 1m neurotoxic and electrolytic lesion (t-test). (c), Apoptotic cells in lesioned LArea X 1 day after the injury. Green, apoptotic cells stained by the TUNEL method; red, Hu labeled neurons; blue, DAPI stained nuclei. The merged panel combines the three labels into one image. Arrowheads point to the lesion boundary. (d), Higher magnification of the boxed regions in c inside and outside lesion showing double label of TUNEL and DAPI.

