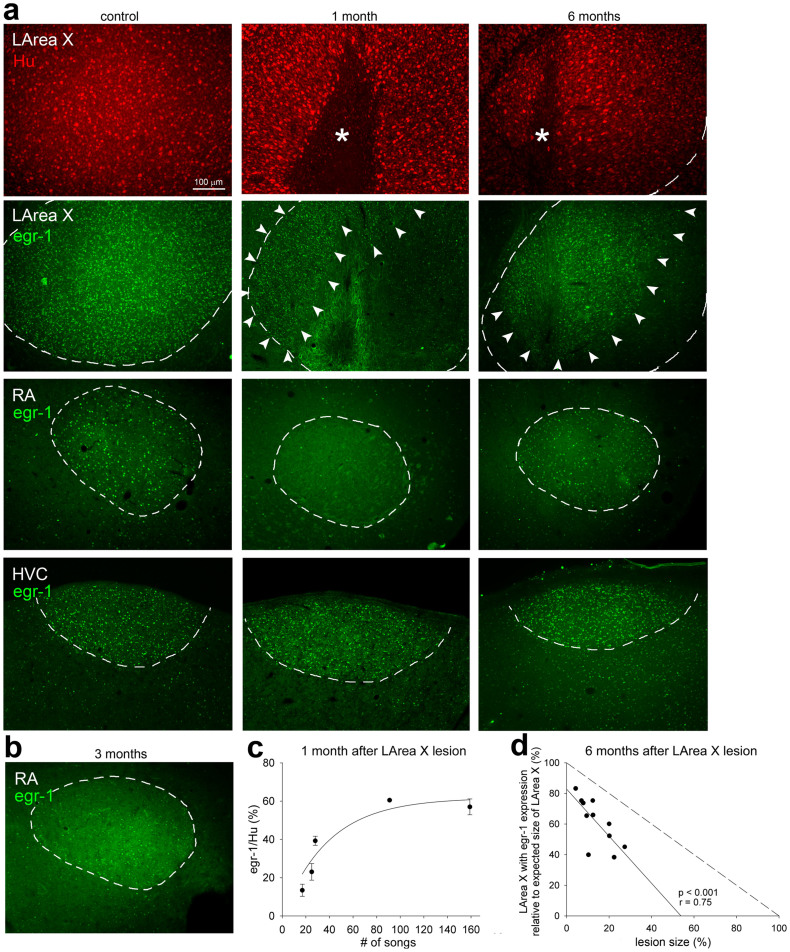
Figure 8. Singing-driven egr-1 expression in the recovered part of LArea X and other song nuclei after neurotoxic lesion.
(a), Representative photomicrographs of LArea X, RA, and HVC in a control and LArea X lesion birds at 1 and 6 months after the injury, singing 72, 159, and 32 undirected songs in 1 h, respectively. Red, Hu staining showing neurons in the control and regenerated LArea X as well as the lesion (*). Green, egr-1 protein signal. Dashed lines designate boundaries of song nuclei based on the Hu label. The arrowheads point to the region within LArea X with higher singing-driven egr-1 expression in the lesioned animals. (b), Representative photomicrograph of singing-driven egr-1 expression in RA of a bird 3 months after LArea X lesion that sung 56 undirected songs, the first time point we noted recovery of singing-driven gene expression in RA. (c), Quantification showing that the proportion of neurons (Hu+) that express egr-1 at 1 month after the lesion increases with the amount of songs produced, indicating that the expression is driven by singing in the lesioned animals. Each point represents mean ± SEM for both hemispheres of one bird. (d), Correlation of lesion size based on Hu staining (non-Hu area divided by the average size of LArea X in control birds; x-axis) with the proportion of LArea X that shows singing-driven egr-1 after the lesion to the average size of LArea X in control birds (y-axis) at 6 months. The values of the two hemispheres for each brain are averaged into one value. The solid line is a linear regression for the lesioned birds. The dashed line is the theoretical expectation on the 45° angle if all of the recovered LArea X showed egr-1 expression.

