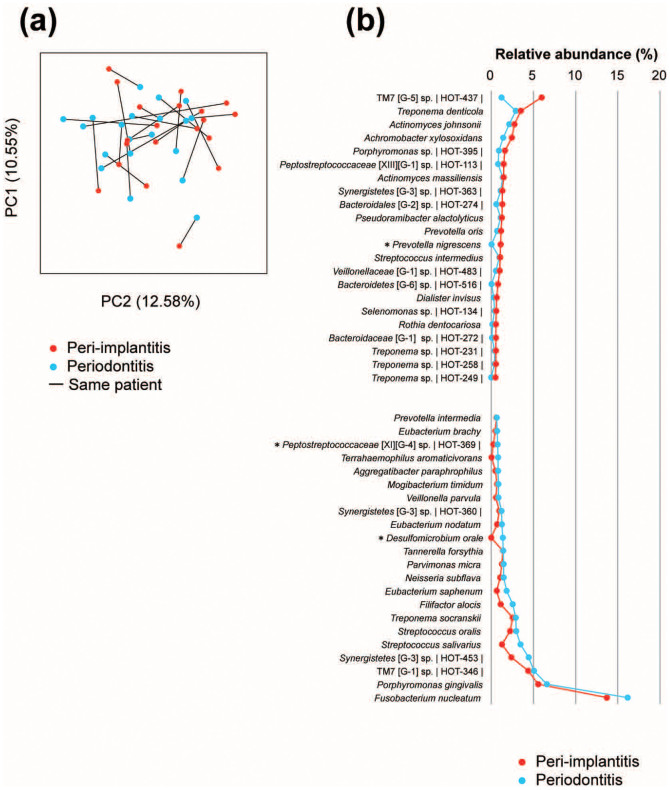
Figure 2. Principal coordinate analysis (PCoA) and microbial differences at the species level.
(a) PCoA plots of the unweighted UniFrac distances for the samples by disease. (b) The most abundant species (>0.5% abundance) in the peri-implantitis and periodontitis samples. The species name or Human Oral Taxon (HOT) ID in the Human Oral Microbiome is shown. The taxonomy assignments were based on information in the Human Oral Microbiome Database, and the statistical differences were calculated by Wilcoxon signed rank tests. *P <0.05 and q <0.1.

