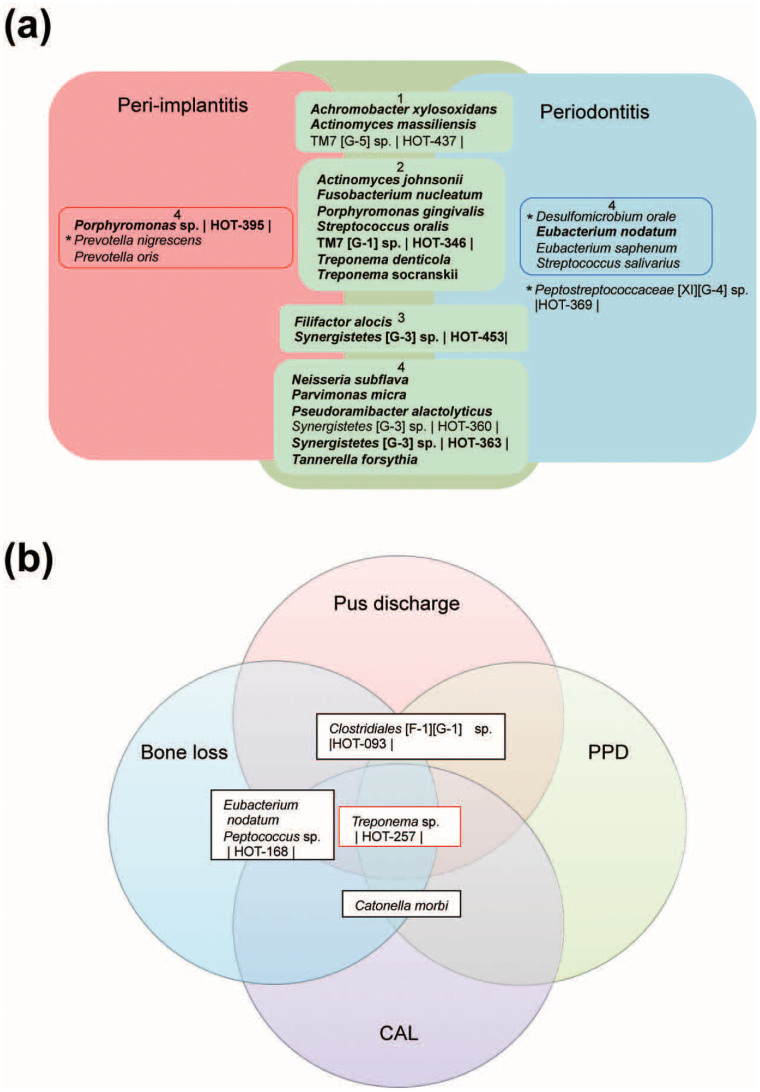
Figure 3. The microbiota associated with peri-implantitis.
(a) The core microbiota of peri-implantitis and periodontitis. The model includes the species detected at peri-implantitis (red), periodontitis (blue), and both sites (green), where the species were found in at least 50% of patients with a mean relative abundance of >1%, or were statistically different (outside of the square boxes; see Figure 2b). The species detected in at least 80% of patients in both sites are indicated in bold. The inner box labelled with 1 indicates a mean relative abundance of ≥2% in periodontitis and <2% in periodontitis. The inner box labelled with 2 indicates a mean relative abundance of ≥2% in both sites. The inner box labelled with 3 indicates a mean relative abundance of <2% in periodontitis and ≥2% in periodontitis. The inner box labelled with 4 indicates a mean relative abundance of <2% in type of site. Peptostreptococcaceae [XI][G-4] sp. HOT369 is statistically abundant, although showed a mean relative abundance of <1% in periodontitis (see Figure 2b). The species name or Human Oral Taxon (HOT) ID in the Human Oral Microbiome Database is shown. The statistical differences were calculated by Wilcoxon signed rank tests. *P <0.05 and q <0.1. (b) Bacterial taxa associated with the progression of peri-implantitis. The model represents all bacterial taxa associated with each of the four clinical parameters of peri-implantitis (P <0.05 and q <0.1). The species name or HOT ID is shown. The taxa correlated to four parameters (red box) and three parameters (black boxes) are shown. PPD, probing pocket depth; CAL, clinical attachment loss.

