. 2014 Oct 13;3:e03726. doi: 10.7554/eLife.03726

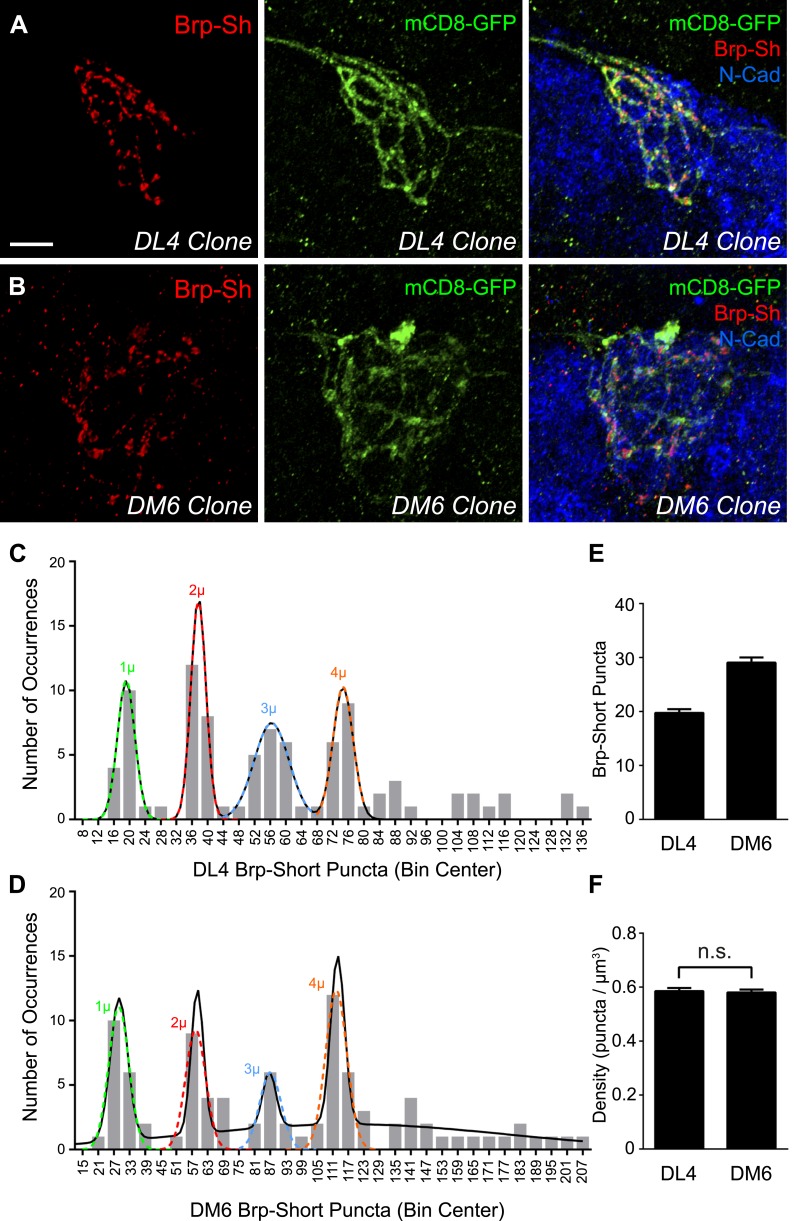
Figure 2. Clonal analysis of ORN synapse number.

Representative high magnification confocal stacks of small clones of DL4 ORNs (A) and DM6 ORNs (B) expressing Brp-Short-mStraw (red) and mCD8-GFP (green). (C) Frequency histogram of Brp-Short puncta in DL4 clones (n = 93 clones from 64 animals). (D) Frequency histogram of Brp-Short puncta in DM6 clones (n = 90 clones from 64 animals). Both graphs exhibit notable periodicity, suggesting that each neuron contributes approximately the same number of synapses. Colored dashed lines indicate Gaussian fits for individual peaks. Solid black lines represent the best-fit sum of Gaussian relationship for each dataset. (E) Quantification of Brp-Short puncta from identified single neuron clones to DL4 (n = 16 clones) or DM6 (n = 17 clones). (F) Quantification of synapse density from all clones. In both DL4 and DM6, the clonal average density is identical to the class average density. In (E) and (F), data represent mean ± SEM. Scale bar = 5 μm.

DOI: http://dx.doi.org/10.7554/eLife.03726.007

Figure 2—source data 1. Table of Gaussian curve-fitting data.
Table of statistical values for three potential sum of Gaussian fits each for the DL4 and DM6 MARCM datasets.
elife03726s001.docx (17.5KB, docx)
DOI: 10.7554/eLife.03726.008
Figure 2—source data 2. Table of resampling approach.
Table of simulation data for three distributions of the DL4 and DM6 MARCM data sets and the probabilities of obtaining simulated data more evenly distributed than observed.
elife03726s002.docx (16.6KB, docx)
DOI: 10.7554/eLife.03726.009

Figure 2.

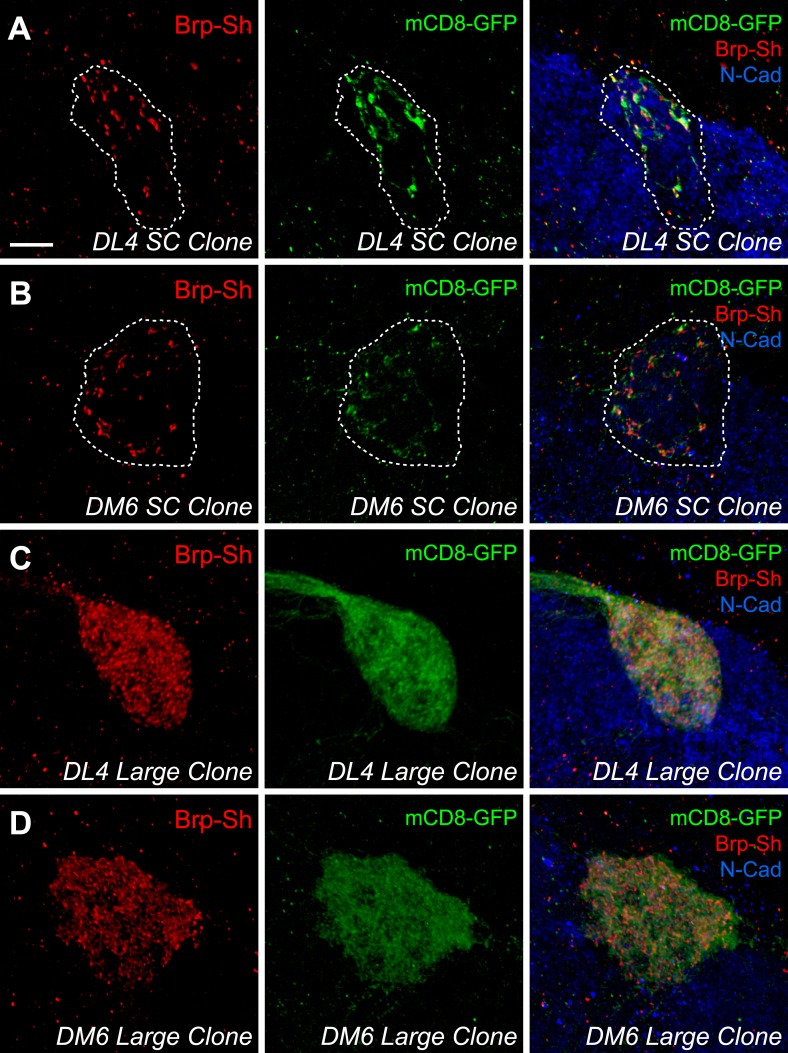
Figure 2—figure supplement 1. Additional DL4 and DM6 ORN MARCM clones.

Figure 2—figure supplement 1.

Representative high magnification confocal stacks of single cell clones of DL4 ORNs (A) and DM6 ORNs (B) and large clones of DL4 ORNs (C) and DM6 ORNs (D) expressing Brp-Short-mStraw and mCD8-GFP and stained for antibodies against mStraw (red), GFP (green), and N-Cadherin (blue). As previously observed (Joo et al., 2013), single cell ORN clones have a low signal-to-noise ratio while discerning larger clones is more evident. In AB, the glomeruli are outlined (dashed line). Scale bar = 5 μm.