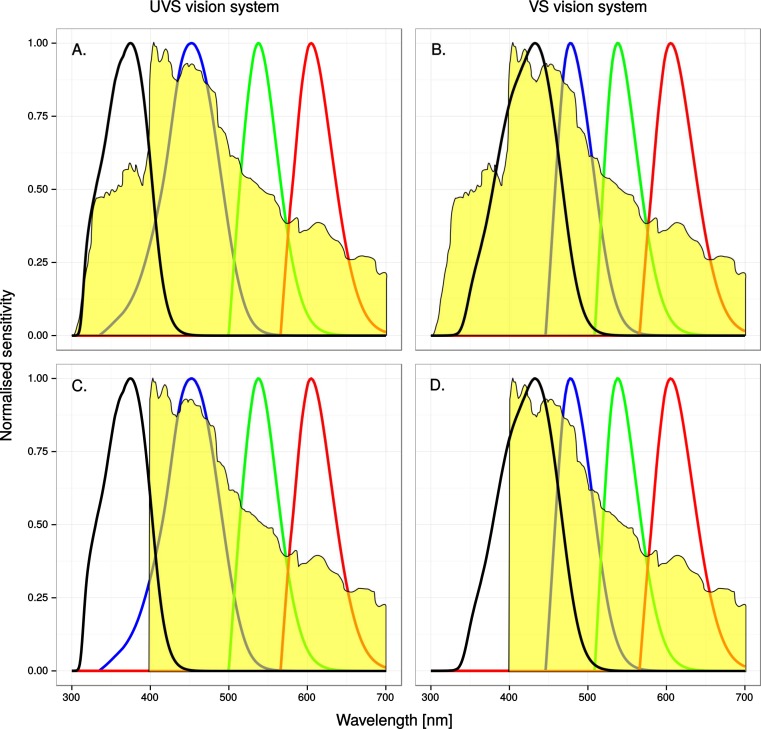
Figure 2. A spectroradiogram of clear sky, unaltered (A) & (B) or modified (C) & (D) to simulate the reflectance of a window marking that completely absorbs ultraviolet radiation below 400 nm, superimposed on normalized single-cone sensitivity.
The four curves represent the UV, SWS, MWS and LWS cones, from left to right. See methods for details.

