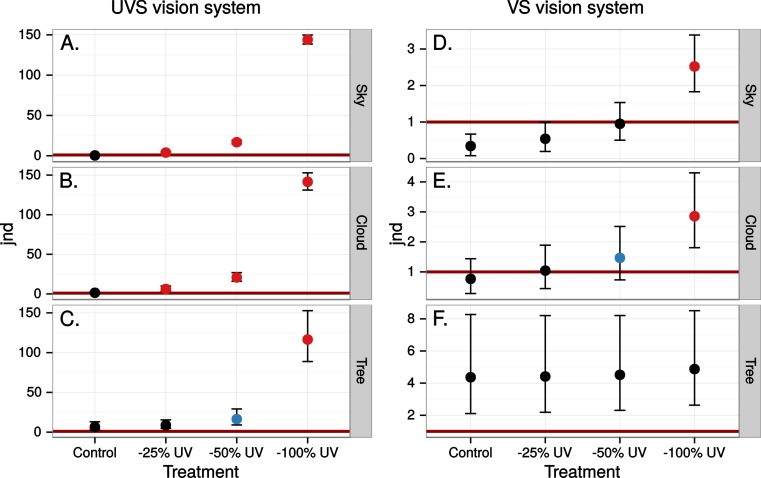
Figure 4. Estimated visibility of simulated markings on perfectly reflecting or transmitting window glass.
The simulated markings reduce ultraviolet (UV) by 25, 50 or 100% compared to unmanipulated glass (Control). Visibility is shown in units of just noticeable differences (jnd), i.e., chromatic contrasts between randomly chosen pairs of patches in the scene, one patch viewed through the marking and the other through the clear window, Geometric mean jnd (points) with 95% confidence intervals (bars) are shown in the graphs. Blue colour means that the mean falls outside the confidence interval of the control and is above 1 jnd. Red colour means in addition that the confidence interval is completely outside the confidence interval of the control. Visibility is modelled from birds with UVS (A–C) and VS (D–E) type of colour vision.

