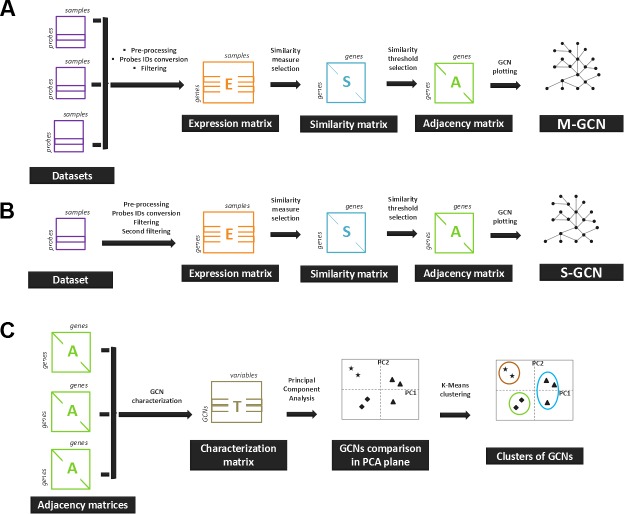
Figure 1. The overall steps for the construction and comparison of the GCNs.
(A) The expression data from several microarray experiments were pre-processed and merged into a single expression matrix. Then, a similarity measurement was used to calculate a similarity matrix. A similarity threshold was chosen, and the adjacency matrix was calculated. The resulting GCN was termed a multiple-experiment GCN (M-GCN). (B) The expression data from a single microarray experiment were processed to assemble the expression matrix. The remaining steps were executed as in (A). The resulting GCN was termed a single-experiment GCN (S-GCN). (C) The adjacency matrices from the GCNs were characterized with the graph variables. The characterization based on network variables was constructed, and the PCA was used to compare the GCNs.

