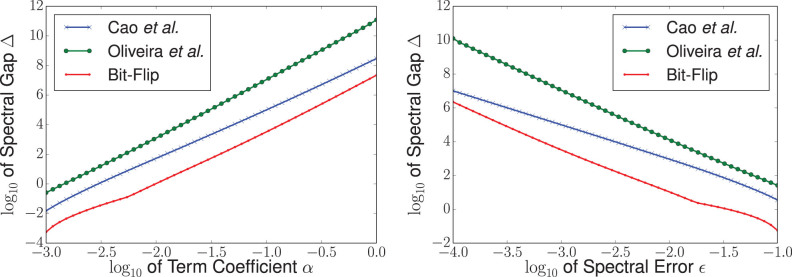
Figure 2. Numerics comparing the minimum spectral gaps required to reduce the term αX1Y2Z3 to 2-local with an error in the eigenspectrum of at most  .
.

On the left,  is fixed at 0.001 and gaps are plotted as a function of α. On the right, α is fixed at 0.1 and gaps are plotted as a function of
  . Here we compare the bit-flip construction77,78, the Oliveira and Terhal construction79 and an improved variant on Oliveira and Terhal by Cao et al.80.
