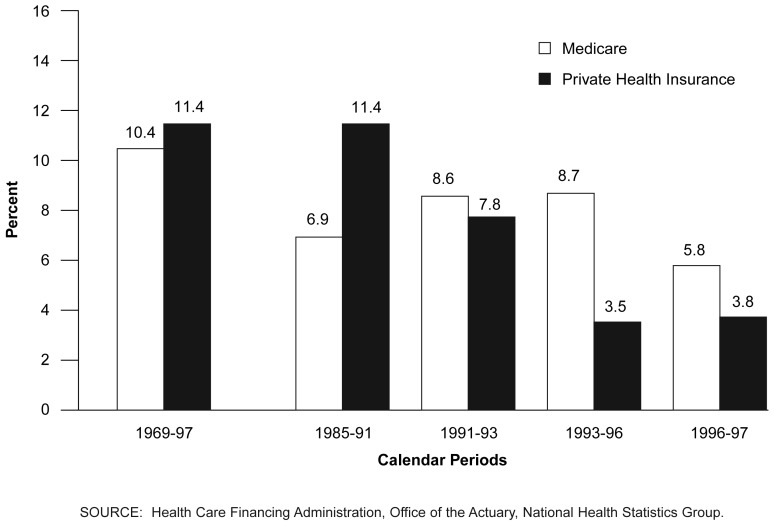
Figure 10. Comparison of Average Growth in Per Enrollee Medicare and Private Health Insurance Benefits: Selected Periods, 1969-97.
The gap between Medicare and PHI per enrollee growth rates narrowed in 1997.
- When compared over the entire 1969-97 period, Medicare and PHI per enrollee benefits grew at comparable average annual rates (10.4 and 11.4 percent, respectively).
- Two recent periods, 1985-91 and 1993-96, marked significant growth differences in expenditures funded by these two sources. Between 1985 and 1991, average annual PHI per enrollee growth exceeded Medicare growth by 4.5 percentage points. However, the relationship between Medicare and PHI per enrollee growth rates reversed over the 1993-96 period, as PHI growth slowed dramatically and Medicare growth maintained historical trend rates. The marked deceleration in PHI growth stemmed, in part, from the migration of enrollees with employer-sponsored health coverage into lower-average-cost managed care plans and the intense competition among all types of plans for market share.
- In the last 2 years, Medicare per enrollee growth has been decelerating, while PHI per enrollee growth has slightly accelerated, narrowing the growth gap between the two major payers. In 1997 Medicare and PHI benefits per enrollee grew 5.8 percent and 3.8 percent, respectively.

