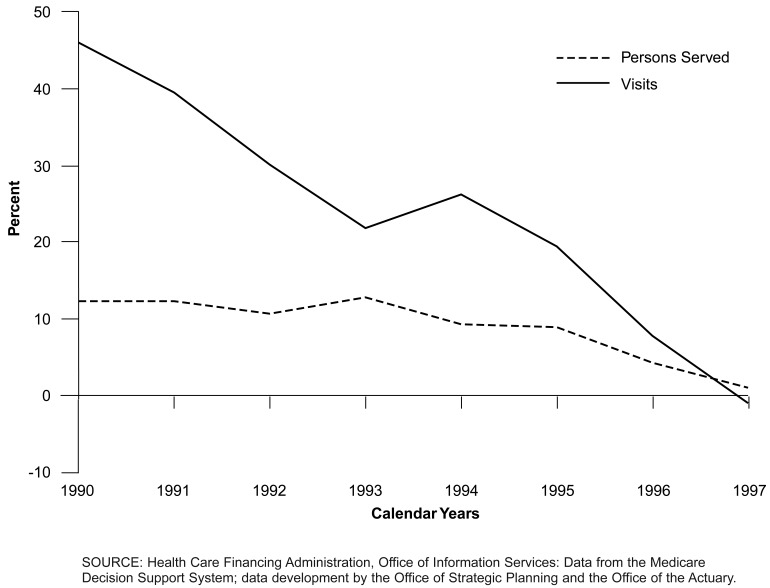
Figure 22. Growth in Number of Persons Served and Visits Per 1,000 Fee-For-Service Enrollees for Medicare Home Health Services: Calendar Years 1990-97.
Medicare home health utilization rates have dropped substantially since 1990.
- Growth in Medicare home health utilization peaked in 1990 after changes in Medicare regulations relaxed coverage and payment criteria. By 1990 the annual growth in all home health visits per 1,000 FFS enrollees reached 46.3 percent. Accelerated growth in the visit and persons-served rates, as well as changes in the mix of visits by type and the ensuing effect on expenditure growth, brought increased scrutiny by HCFA of the home health industry and prompted changes in Medicare home health regulations as well as reforms to the Medicare home health benefit under the BBA.
- HCFA's fraud and abuse detection activities resulted in a number of criminal proceedings and civil actions against certain home health agencies (HHAs). Intensified medical review efforts to curb fraud, waste, and abuse of Medicare home health claims led to increased claims denials and subsequent appeals by providers that were either upheld or, at the least, may have resulted in payment delays.

