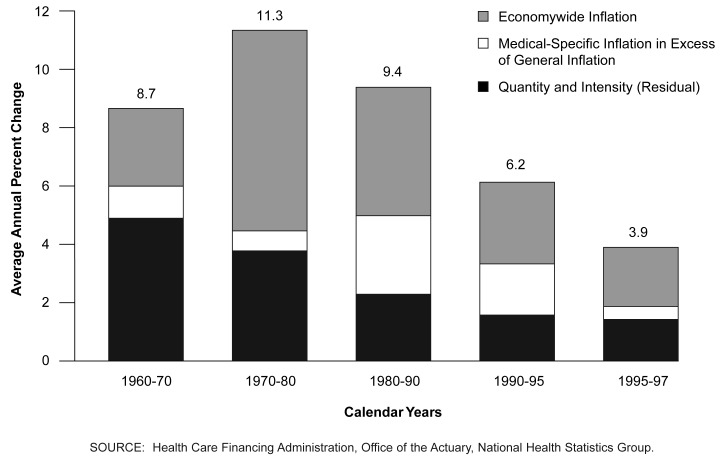
Figure 5. Factors Accounting for Growth in Per Capita Personal Health Care Expenditures: Selected Periods 1960-97.
Since 1990 medical-specific inflation has decreased dramatically.
- On a per capita basis, nominal spending for personal health care grew at a 3.9-percent average annual rate between 1995 and 1997. Of the 3.9 percent, economywide inflation accounted for 2.2 percent; net medical-specific price inflation (in excess of general price inflation) accounted for just 0.4 percent; and the quantity and intensity of personal health care per person represented 1.4 percent. Quantity and intensity of services is a residual amount reflecting changes in quantities of services delivered, age/sex composition of the population, technological improvements, and any measurement errors in expenditures, inflation, or population.
- Between 1970 and 1980, economywide inflation was the driving force behind high per capita health spending increases, which grew 11.3 percent on an average annual basis during the period. Between 1980 and 1990, per capita health spending grew at a 9.4-percent average annual rate. During this period, price inflation was again the major force, but net medical-specific inflation played a much larger role. However, since 1990 net medical-specific inflation has decreased significantly, partly as a result of successful efforts by many insurers to negotiate discounts with providers.

