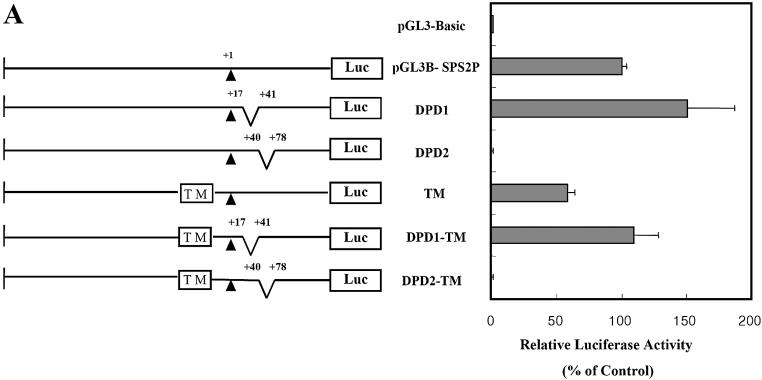
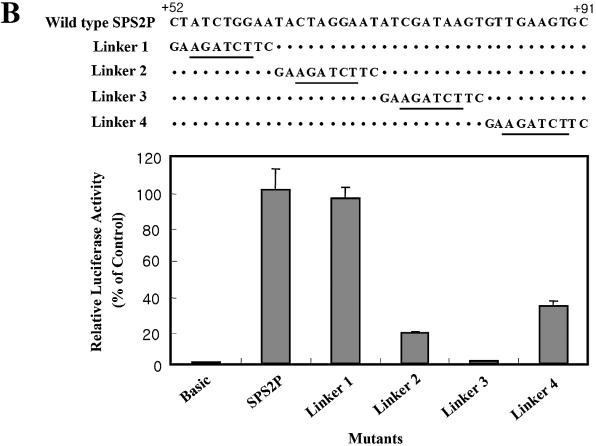
Figure 3.
Effect of deletion and base substitution mutagenesis on the promoter activity of dsps2. Each mutant construct was transfected into SL2 cells and their relative promoter activities measured by luciferase assay. (A) Deletion mutant analysis. A series of deletion constructs are shown on the left; their designations are described in the middle and their corresponding luciferase activities on the right. The uppermost construct designated pGL3-Basic is the negative control, the construct designated pGL3B-SPS2P is the wild-type control, wherein +1 shows the transcription start site, and the upstream TM in the box designates the TATA box mutant. (B) Linker mutant analysis. Sequences of linker mutants are shown in the upper portion, wherein the BglII sequence is underlined, and the graph in the lower portion represents their luciferase activities relative to that of the wild-type activity. The standard deviations from the mean are indicated by error bars.


