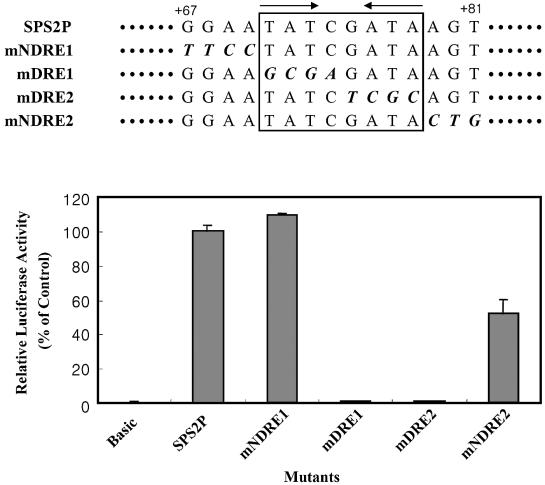
Figure 4.
Effect of mutagenesis in and around DRE on promoter activity. Base substitution mutations in and around DRE are represented in the upper portion of the figure, and their relative luciferase activities in the lower portion. SPS2P designates the wild-type sequence and the others designate the mutant sequences. Mutations are shown in italics and bold in the DRE region within the box. Arrows designate the palindromic sequence of DRE. The standard deviations from the mean are indicated by error bars.

