
Figure 1.
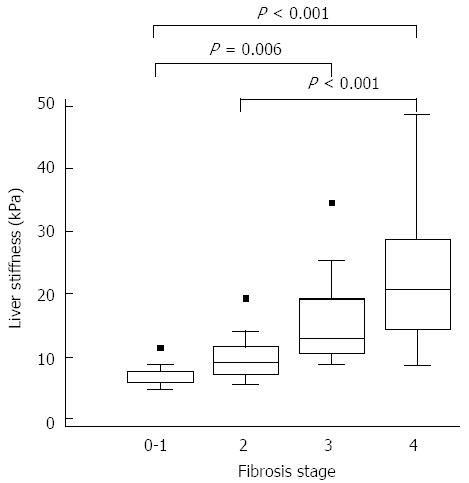
Score values of liver stiffness by according to fibrosis stage (n = 70). Boxplots summarize the liver stiffness by shear wave elastography (SWE) for each fibrosis classification. For each box, the box gives the interquartile range, that is, the 25th to 75th percentiles of liver stiffness by SWE, with line inside the box denoting the median, the 50th percentile of data. Statistical significant test was done by Tukey test using ranks.