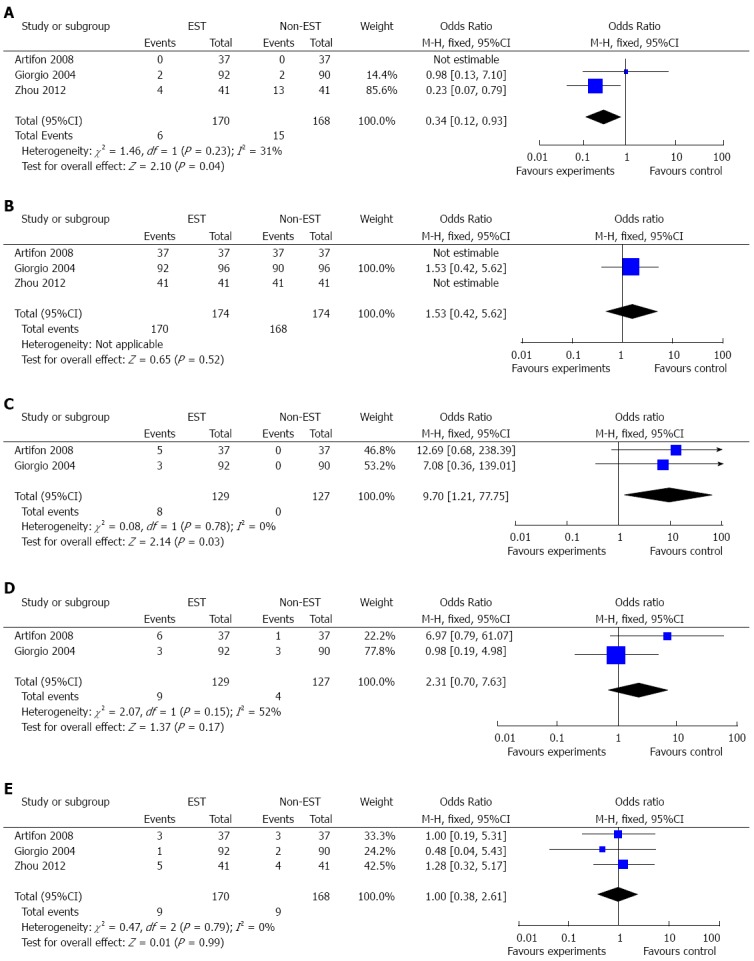
Figure 2.

Forest plot. A: Comparison of the incidence of post-endoscopic retrograde cholangiopancreatography (ERCP) pancreatitis (PEP) between the endoscopic sphincterotomy (EST) and non-EST groups; B: Comparison of the rate of successful stent insertion between the EST and non-EST groups; C: Comparison of the rate of post-ERCP bleeding between the EST and non-EST groups; D: Comparison of the rate of stent migration between the EST and non-EST groups; E: Comparison of the rate of stent occlusion between the EST and non-EST groups.
