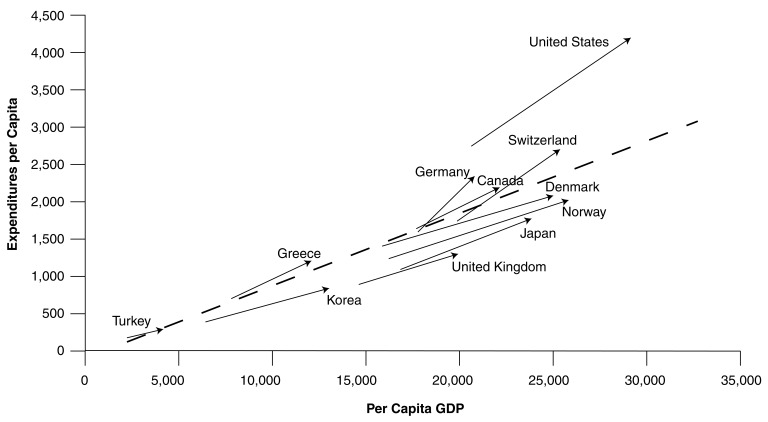
Figure 5. Change in per Capita Health Care Expenditures Relative to Change in per Capita GDP1 1990-1997.
1Measured in US$ purchasing power parities.
NOTES: GDP is gross domestic product. The beginning of the arrows indicates health spending and GDP per capita in 1990. The end of the arrow indicates the corresponding values for 1997.
SOURCE: (Organization for Economic Cooperation and Development, 1999a.)

