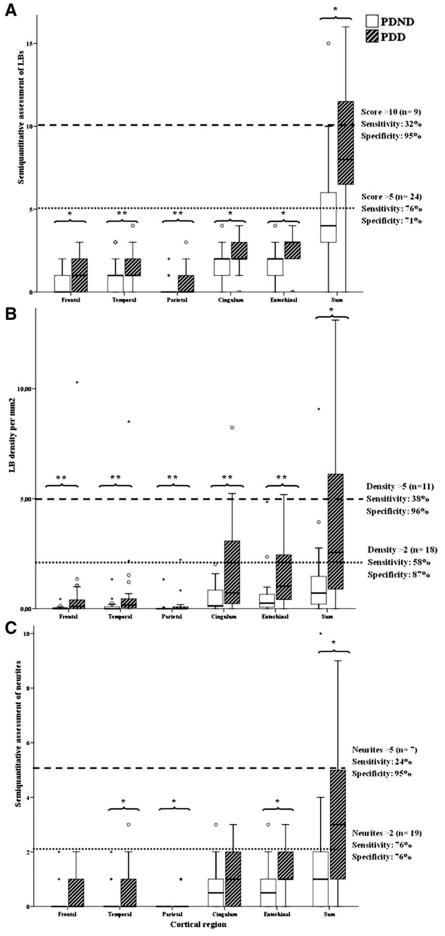
Figure 2.
(A) Bar diagrams of regional and total semi-quantitative Lewy body (LB) scores with dashed and dotted lines, respectively, delineating cut-off values of 10 and 5 (score >10: 88% PDD; score >5: 79% PDD). (B) Bar diagrams of regional and total Lewy body (LB) densities with dashed and dotted lines, respectively, delineating cut-off values of 5 and 2 (scores >5: 91% PDD; scores >2: 83% PDD). (C) Bar diagrams of the regional and total semi-quantitative Lewy neurite scores with dashed and dotted lines, respectively, delineating cut-off values of 5 and 2 (scores >5: 86% PDD; scores >2: 74% PDD). *P < 0.005; **P < 0.05.

