
Fig. 2.
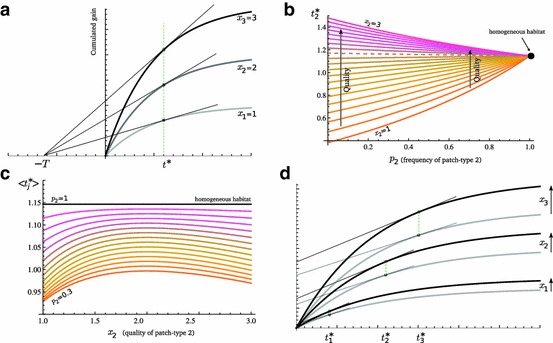
Scaling the gains and invariance. Function (21) is used as an illustration of class (23). a For homogeneous habitats, holding travel time fixed at , is invariant to quality (green vertical line). b always increases with (vertical arrows), except in the homogeneous case (dot on the far right). In this example and were varied in a habitat with two other patch-types, having qualities and , and relative frequencies . Remark that increasing increases if it decreases (low values, below dotted curve) and decreases otherwise (high values, above dotted curve). c Except in the homogeneous case (black line), the average residence time varies with . It increases for low values and decreases for high values. d In a heterogeneous habitat, if all gain functions are scaled by the same factor, optimal residence times do not vary. In this example, all values where multiplied by (from gray to black). Other parameters: , (color figure online)