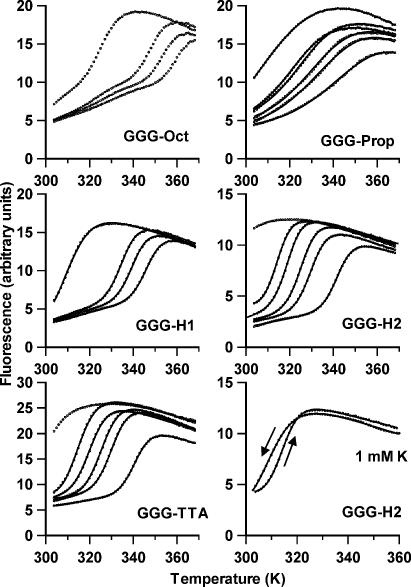
Figure 4.
Fluorescence melting curves for the oligonucleotides in the presence of 10 mM lithium phosphate pH 7.4 containing different concentrations of KCl. The samples were heated and cooled at 0.2°C min–1. In each case the potassium concentration increases from left to right; 0, 1, 2 and 5 mM KCl for GGG-Oct and GGG-H1 and 0, 1, 2, 5, 10 and 40 mM KCl for GGG-Prop, GGG-H2 and GGG-TTA. The bottom right hand panel compares the melting and annealing curves for GGG-H2 in the presence of 10 mM lithium phosphate, containing 1 mM KCl. In each case the solid lines show van’t Hoff fits to the data points as described in the Materials and Methods section.

