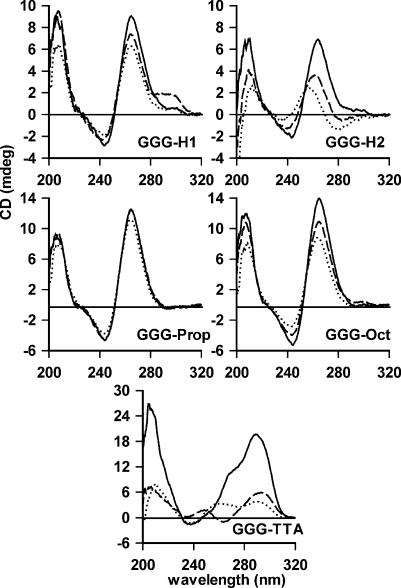
Figure 5.
CD spectra of the fluorescently labelled oligonucleotides. The oligonucleotides (5 µM) were dissolved in 10 mM lithium phosphate pH 7.4 (dotted lines) containing 50 mM potassium chloride (solid lines) or 50 mM sodium chloride (dashed lines). The spectra for GGG-Prop in the presence of sodium and potassium are superimposed.

