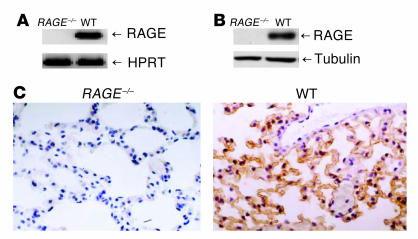
Figure 1.
Generation and characterization of RAGE–/– mouse line. (A) RT-PCR of lung tissue from RAGE–/– and WT mice analyzed for RAGE mRNA expression. WT indicates RAGE+/+ littermates. HPRT was used to demonstrate equal loading. (B) Western blot analysis of RAGE–/– and WT lung tissue analyzed for the presence of RAGE protein (43 kDa). Tubulin demonstrates equal loading. (C) Immunohistology for RAGE protein in WT and RAGE–/– lung tissue. Brown staining indicates RAGE expression; magnification, ∞400.

