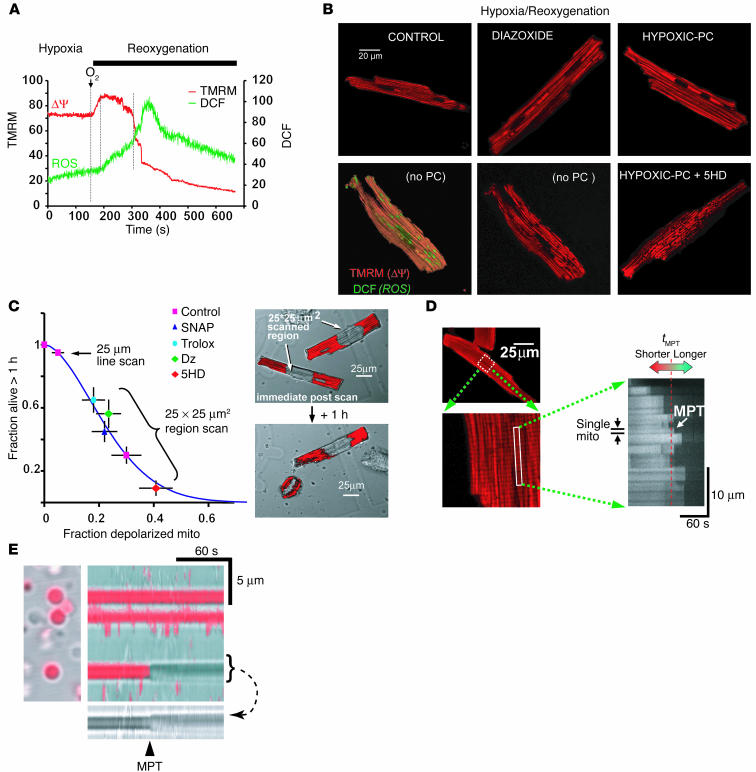
Figure 1.
ROS are involved in mitochondrial deterioration during hypoxia/reoxygenation. (A) Reoxygenation-induced mitochondrial hyperpolarization leads to increased ROS. Mitochondria stained with TMRM (ØΨ, red) and DCF (ROS, green) were laser line-scanned (2 Hz) during hypoxia and the reoxygenation phase. The ROS burst is delayed after reoxygenation and starts at the maximum ØΨ. Mitochondrial hyperpolarization lasts for approximately 2 minutes, followed by loss of ØΨ. (B) ØΨ loss in a significant fraction of mitochondria, caused by hypoxia/reoxygenation. Depolarized mitochondria (red-fluorescence “holes”; bottom panels) are associated with increased ROS (green; bottom left panel). Hypoxic PC or pharmacologic PC (represented by Dz) prevents mitochondrial depolarization, and 5HD accentuates the loss. (C) Cell survival after constant-energy photoexcitation of a 25 ∞ 25 ∝m2 region. The right panels show TMRM-stained cells (red) immediately after, and 1 hour after, irradiation. Survival is inversely related to the fraction of mitochondria (mito) undergoing MPT induction and is improved by ROS scavenger (Trolox), NO donor (SNAP), and Dz and impaired by 5HD. (D) Methodology used to determine the ROS threshold of MPT induction. Mitochondria stained with TMRM (red) were laser line-scanned until MPT induction. The average time required for the standardized photoproduction of ROS to cause MPT induction (tMPT) is taken as the index of the ROS threshold in that cell. (E) Two-hertz line scan of individual isolated cardiac mitochondria. Light transmittance (gray) and TMRM fluorescence (red) are overlaid. The abrupt loss of ØΨ (TMRM) and increase in volume (arrow) are similar to those observed in situ (D). Vertical flickering in the image is an artifact caused by movement of adjacent floating mitochondria.

