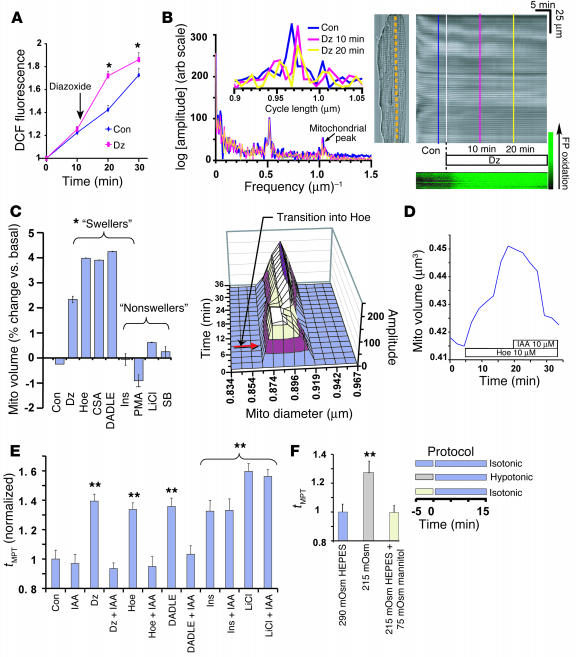
Figure 4.
Mechanisms of protection dependent on mitochondrial swelling. (A) Enhanced ROS generation (in DCF-loaded cells, n > 50) during mitoKATP activation by Dz. *P < 0.02 vs. control. (B) Assessment of change in mitochondrial volume after Dz treatment by Fourier analysis. Laser line-scan imaging of in situ mitochondria was performed along the long axis of the cell (right panels) during Dz exposure. High-resolution transmittance (gray image) and flavoprotein autofluorescence (488 nm excitation, green image) were obtained simultaneously. The left panel shows the Fourier frequency-domain spectrum from the transmittance line-scan data during the control period and periods of treatment with Dz for 10 and 20 minutes. The first-order peak indicates the regular sarcomere Z structure. The spectrum inset enlarges the second-order peak shifts (converted to micrometer scale), indicating small Dz-mediated changes in mitochondrial volume. Arb scale, arbitrary scale; FP flavoproteins. (C and D) Mitochondrial-volume changes induced by swellers and nonswellers (“SB” indicates SB 415286). C (right panel) and D show time-dependent volume changes after Hoe, and the reversal of the swelling effect by inhibition of Cl_ transport using IAA94 (D). Ins, insulin. (E) Protection by mitochondrial swellers (but not by nonswellers) requires Cl_ channel flux. (F) Osmotic change induces modulation of tMPT measured under isotonic conditions and 15 minutes after transient (5 minutes) hypotonic conditions. **P < 0.01 (and all bars under brace) vs. control (E and F).

