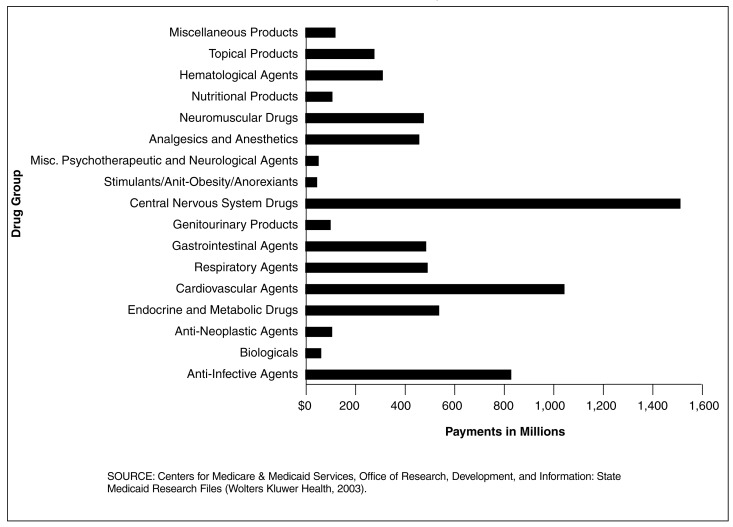
Figure 1. Medicaid Prescription Drug Payments for 29 SMRF States All Eligibles, by Drug Category: 1998.
Central Nervous System (CNS) Drug Payments Exceeded $1.5 Billion in the 29 SMRF States
- For all four eligibility groups, CNS drug payments were over 48 percent greater than the second highest drug category, cardiovascular agents.
- Even though CNS drug payments exceeded payments for all other drug groups, the number of CNS prescriptions dispensed was not the highest. Prescriptions dispensed for cardiovascular agents outpaced CNS drugs 31.4 to 24.8 million.
- Medicaid payment per prescription for all eligibles in 1998 for these 29 States was highest, by an overwhelming margin, for biologicals at nearly $590 each (data not shown). Of the 17 drug groups, 15 averaged under $82 per perscription. In this comparison, CNS drug payments per prescription was comparable to most of the other groups and did not exhibit atypical cost averages.
- In 1998, the disabled eligibility group constituted a 55.3 percent share of the total Medicaid prescription drug payments (data not shown). The trend has shown yearly increases since at least 1990 when the disabled's share of drug payments was 42.2 percent of the total, an amount higher than any of the other three eligibility groups. This study highlights the increasingly important impact of the disabled on Medicaid payments and CNS drug use.

