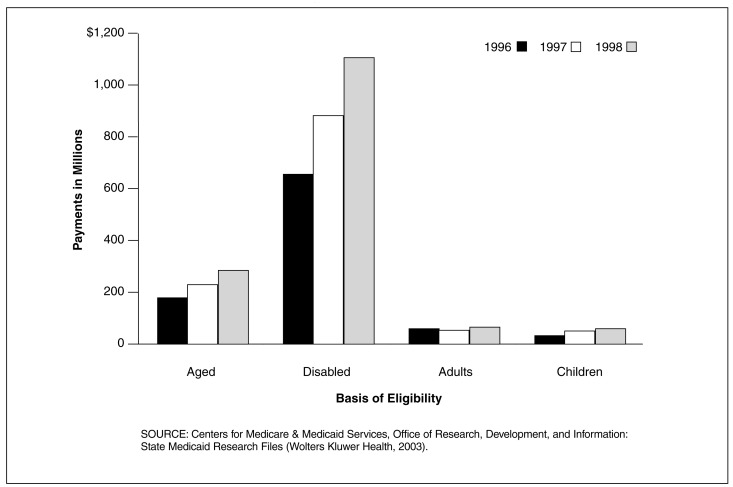
Figure 3. Medicaid Central Nervous System (CNS) Drug Payments for 29 SMRF States, by Basis of Eligibility: 1996-1998.
In the 29 SMRF States, the Disabled had the Largest Share of CNS Drug Payments
- The disabled had $658 million in CNS drug payments in 1996, $840 million in 1997, and $1,102 million in 1998. The disabled had the largest share of CNS drug payments for all 3 years.
- The largest change in share was a modest increase for the disabled which experienced an increase from 71.4 percent of the total spending for CNS drugs in 1996 to 72.9 percent in 1998.
- From 1996 to 1998 there was virtually no shift in the share of payments for CNS prescription drugs based on eligibility. The aged received about 19 percent, the disabled received about 72 percent, adults received about 5.5 percent and children received only 3.2 percent.
- By no means should these seemingly mild changes in spending shares indicate that CNS drug spending is under control. The unchanging nature of the share of payments may actually be a concern for the Medicaid Program since payments for these years may serve as indicators that high CNS payments could burden Medicaid for the foreseeable future. The breakdown of payments by basis of eligibility for these 3 years merely indicates how CNS drug payments have been channeled to these 4 segments of the population.

