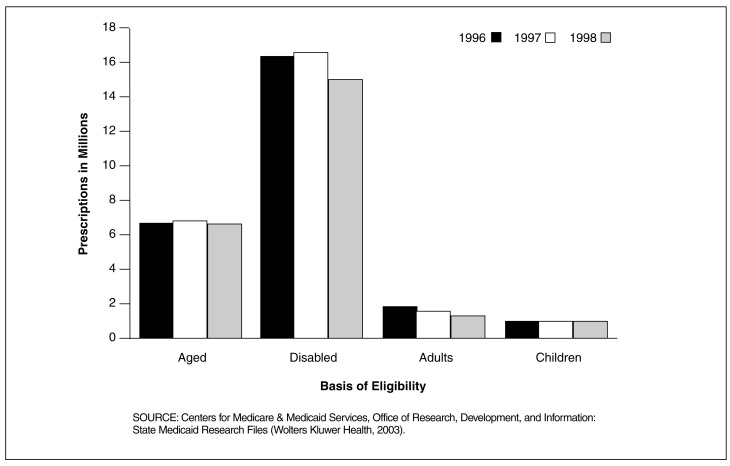
Figure 4. Medicaid Central Nervous System (CNS) Drug Prescriptions for 29 SMRF States, by Basis of Eligibility: 1996-1998.
Disabled Medicaid Recipients Clearly Used More Prescription CNS Drugs Than Any Other Eligibility Group From 1996 to 1998 in the 29 SMRF States
- The disabled accounted for 16.3 million prescriptions in 1996, 16.5 million in 1997, and 15.7 million in 1998. The trend in fewer prescriptions is true for all four eligibility groups. From 1996 to 1998 disabled Medicaid recipients received 15 times the number of prescriptions that children received.
- Each of the four eligibilty groups had fewer prescriptions dispensed in 1998 than in 1996. Adults had the greatest decrease in number from 1.90 million in 1996 to 1.26 million in 1998.
- In 1996 there were 26.1 million FFS CNS drug prescriptions dispensed for all groups compared to 24.7 million in 1998. Why does it appear that CNS prescription drug use among Medicaid recipients decreased? One possible explanation could be the increased enrollment in prepaid plans from 1996 to 1998 in these States. Reporting number of prescriptions paid by prepaid plans is unreliable at this time. However, in the same period in which the number of prescriptions declined, CNS drug payments increased by 63.9 percent.

