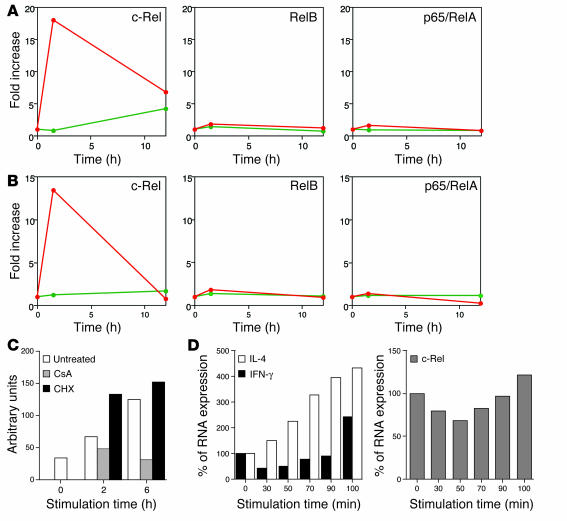
Figure 5.
Induction of NF-κB family members in activated NKT cells. (A) Plotted values represent data of Affymetrix microarray analysis for the indicated genes.The αGC-stimulated (red lines) or OCH-stimulated (green lines) cells as well as unstimulated liver NKT cells were analyzed at the same time points and the data are presented as the relative value for stimulated NKT cells when the value in NKT cells derived from untreated animals was defined as 1. (B) Real-time PCR analysis for the same genes as in A. Data are presented as described in Figure 4. (C) Sorted liver NKT cells were pretreated with CsA or CHX and were stimulated with immobilized mAb to CD3, and comparative values of c-Rel transcripts relative to GAPDH were determined. (D) Sorted liver NKT cells were stimulated with immobilized mAb to CD3 for the indicated periods of time and then were cultured without stimulation for up to a total of 120 minutes after the initial stimulation. Total RNA was extracted from each sample and analyzed for relative amounts of transcripts of IFN-γ or IL-4 (left), or c-Rel (right). The amount of RNA derived from unstimulated NKT cells was defined as 100%.

