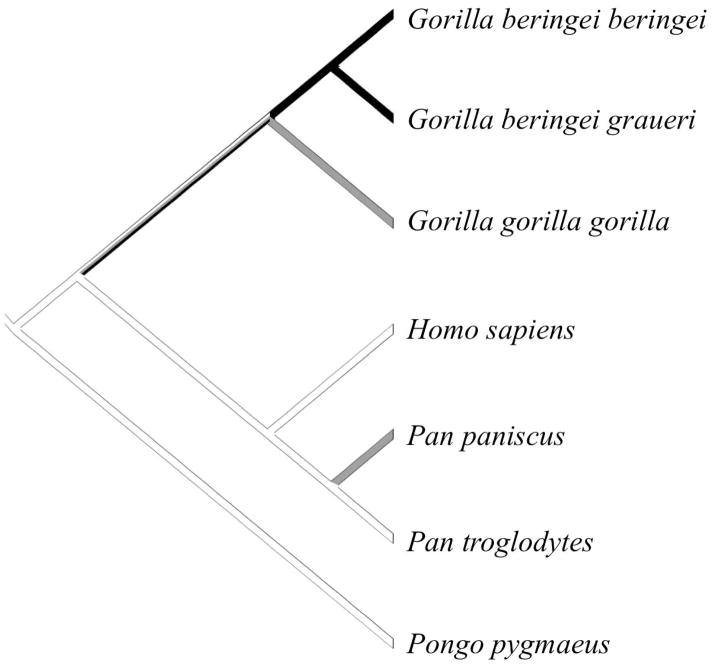
Figure 2.
Phylogenetic distribution of temporo-insular fusion in great apes. Black branches indicate fusion is common (present in 60% or more specimens). Gray branches indicate intermediate prevalence of fusion (present in 20–59% of specimens). White branches indicate fusion is rare or absent (present in fewer than 20% of specimens).

