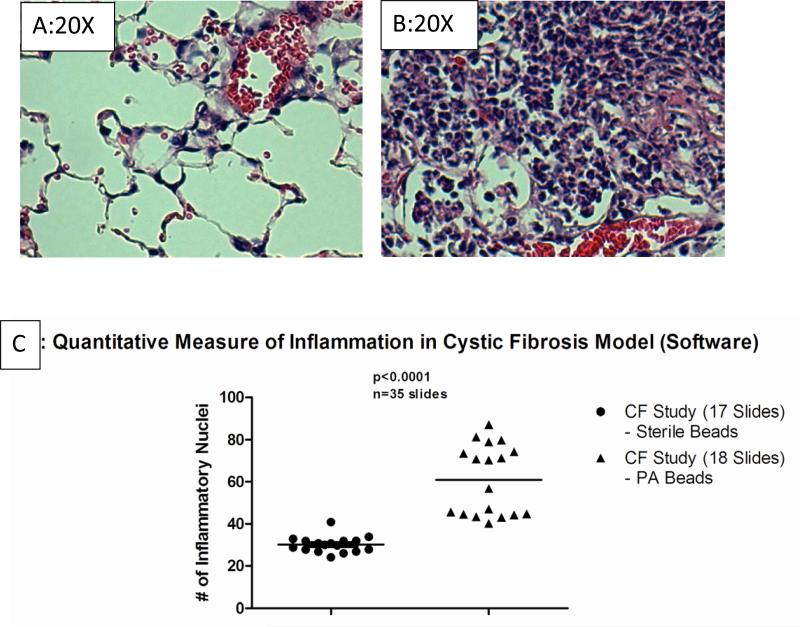
Figure 2. A Representative Section from the Cftr KO Murine Model.
Cftr knockout mice without infection are shown for comparison (Figure 2A) and are similar to wild type mice (data not shown). These studies show enhanced inflammatory cell recruitment (Figure 2B) in response to agar beads impregnated with Pseudmonas aeruginosa. The software then analyzed each image and determined the number of inflammatory nuclei. The mean value is designated to each slide after viewing 196 images. The scatter plot shows the relative number of inflammatory nuclei for sections from Cftr KO mice given sterile agarose beads (Figure 2C, n=17 slides) versus Pseudomonas aeruginosa impregnated agarose beads (Figure 2C, n=18 slides). The ImagePro program defined the inflammatory difference to be significant at p<0.001.

