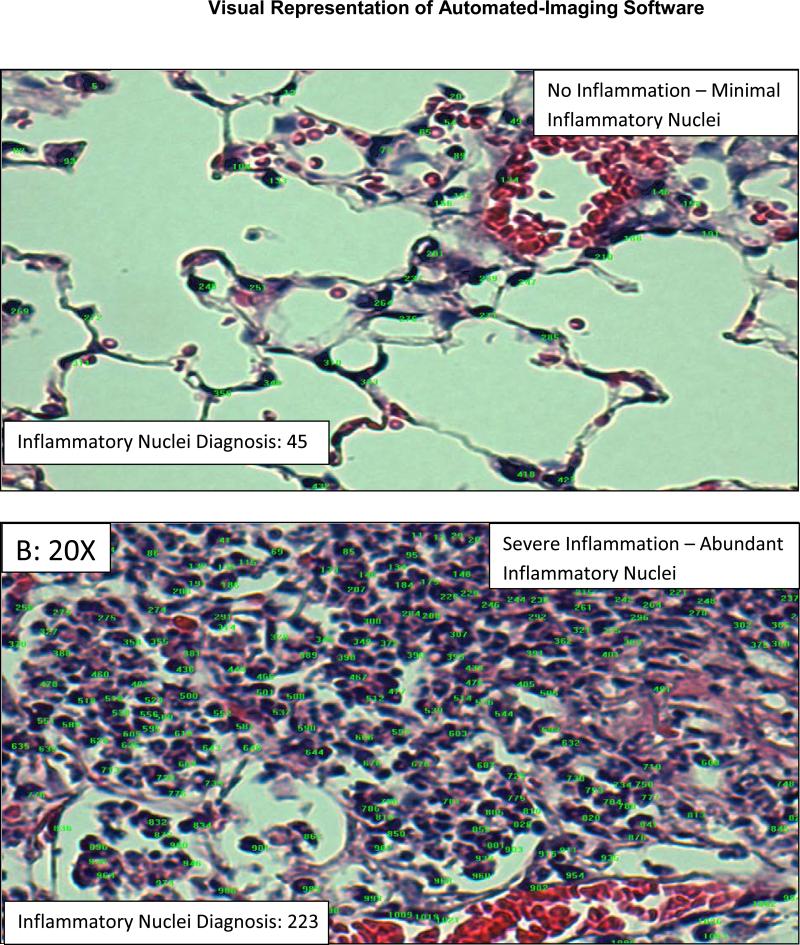
Figure 3. Inflammatory Nuclei Diagnosis (Software) – chronic asthma/Cftr KO Lung Model: Precision Test.
The software then analyzed each image and determined the number of inflammatory nuclei; this number is shown in the bottom left-hand corner of each image. The green numbers represent nuclei that are of the right color, while the purple highlights represent nuclei that are of the right size. Inflammatory nuclei are only counted if they are of the right color and size.

