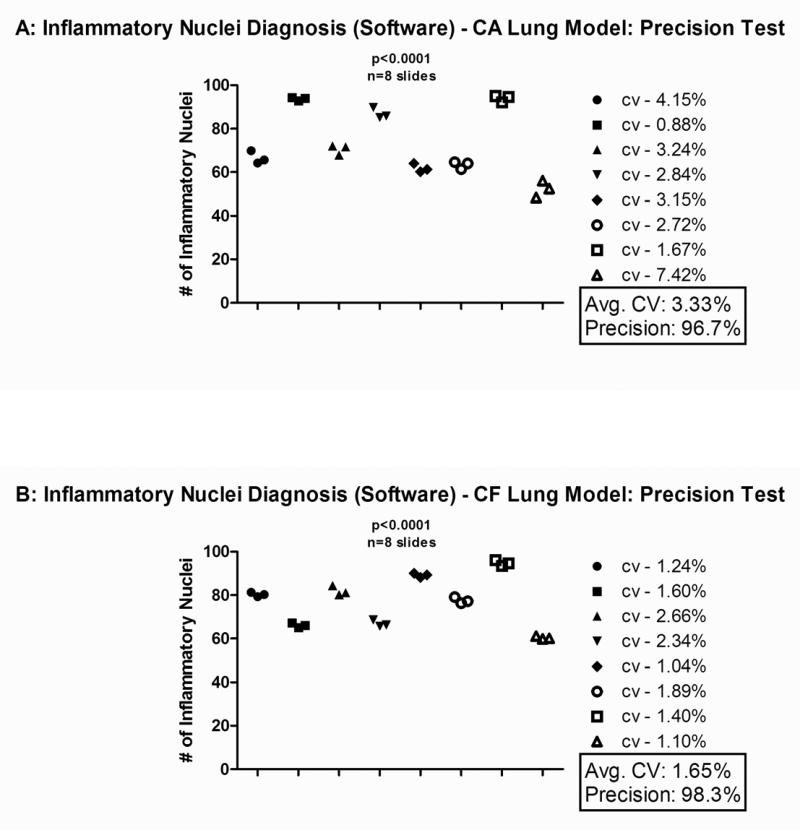
Figure 4. Data Analysis of the Chronic Asthma and Cftr KO Murine Model Inflammation.
The following data was obtained from eight different slides, each containing three lung sections from the same mouse at varying depths. The software assigned each lung section with a number of inflammatory nuclei. These numbers were plotted based on the slide/mouse from which they came. The coefficient of variation (the standard deviation divided by the mean) was calculated for each mouse based on the number of inflammatory nuclei that each of the three lung sections possessed. This value is represented next to each symbol denoting a set of lung sections as the “CV” value. From this the level of precision (in %) was determined by multiplying the CV value by 100 and then subtracting that number from 100. Next to the graph is the mean CV and the mean precision for the 8 slides shown. This test was applied to the murine ovalbumin chronic asthma lung model in Figure 4A and to the Cftr KO Pseudomonas aeruginosa infection model in Figure 4B. The mean CV was 3.33% and the mean precision was 96.7% for the chronic asthma lung model. The mean CV was 1.65% and the mean precision was 98.3% for the Cftr KO Pseudomonas aeruginosa infection model.

