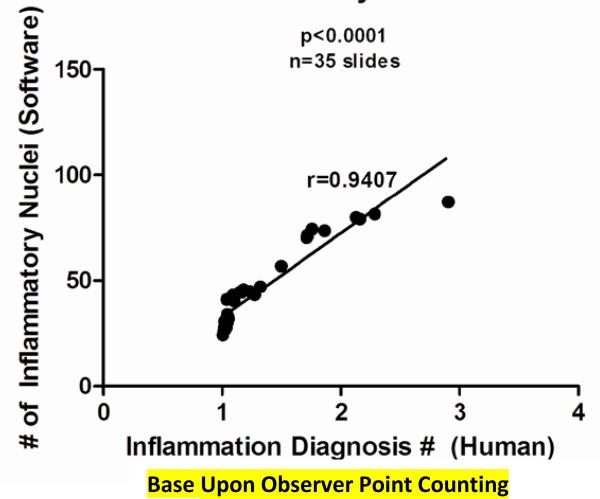
Figure 5. Correlation Scatter Diagram of Manual Point Counting VS Quantified Inflammation Software: Accuracy Test.
The following data was based on two values. A value based upon manual point counting was given to each of the 35 sets of lungs using the Cftr KO Pseudmonas aeruginosa infection model. The point counting value was based on looking at 500 frames from a single lung and diagnosing each frame as either a 1, 2, 3, or 4. 1 represented no inflammation, 2 represented mild inflammation, 3 represented moderate inflammation, and 4 represented severe inflammation. These values were then averaged to determine an inflammation diagnosis value for each of the 35 sets of lungs. This value served as the x-coordinate for each lung. Second, a software-based diagnosis of inflammation was given to each of the 35 sets by determining the average number of inflammatory nuclei per lung. This value served as the y-coordinate for each lung. These points were then plotted and a trend-line (best-fit-line) was drawn. The coefficient of correlation (r-value) was then calculated. The coefficient of correlation was 0.94, indicating a very strong positive correlation between manual point counting and the software with p<0.0001.

