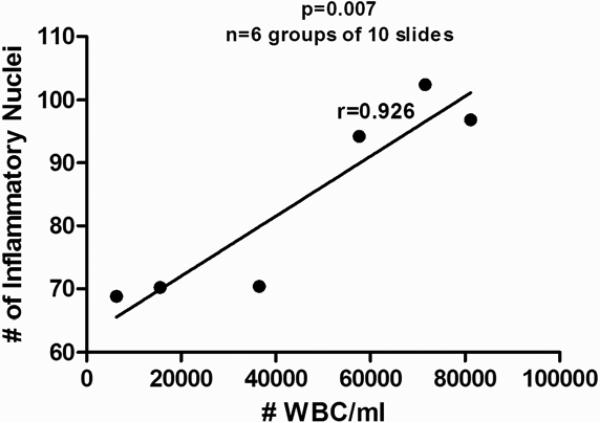
Figure 6. Correlation Scatter Diagram of BAL White Blood Cells VS Quantified Inflammation Software: Accuracy Test.
The average number of white blood cells per milliliter of BAL fluid (#WBC/ml) was determined for six groups of mice, each group containing 10 mice using the chronic asthma murine model. This value served as the x-coordinate for each group. The average number of inflammatory nuclei was then determined by the software for each group. This value served as the y-coordinate for each group. These points were then plotted and a trend-line (best-fit-line) was drawn. The coefficient of correlation (r-value) was then calculated. The coefficient of correlation was 0.926, indicating a very strong positive correlation between the number of white blood cells in a given sample and the software with p<0.0001.

