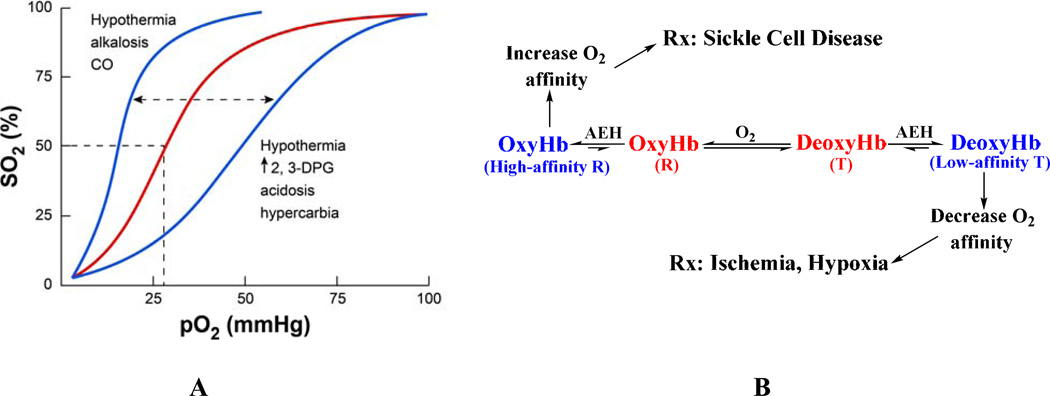
Figure 2.
The allosteric mechanism of Hb. (A) Oxygen equilibrium (or dissociation) curve of Hb. The normal P50 value is indicated by dashed lines. The left-shift and right-shift in the curves (blue color) are associated with various conditions, including AEHs. (B) Modulation of Hb allosteric transition by synthetic AEHs. Stabilization of either the R-state or T-state (colored blue) has potential therapeutic applications. The “R” represents all identified relaxed states including R2, R3, RR2, RR3, and the classical R.

