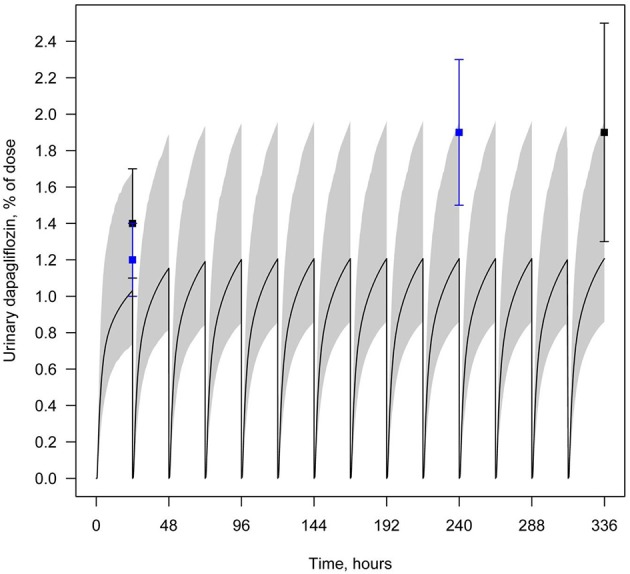
Figure 5.

Example of validation of the dapagliflozin model using urine data. Amount of dapagliflozin recovered in urine every 24 h following simulation of multiple administrations of 10 mg QD. Curve represents model simulation and dots represent experimental data. Colors of dots correspond to the different data sources: black—Kasichayanula et al. (2011a), blue—Yang et al. (2013). Model simulation is presented with 95% confidence bands.
