
Figure 7.
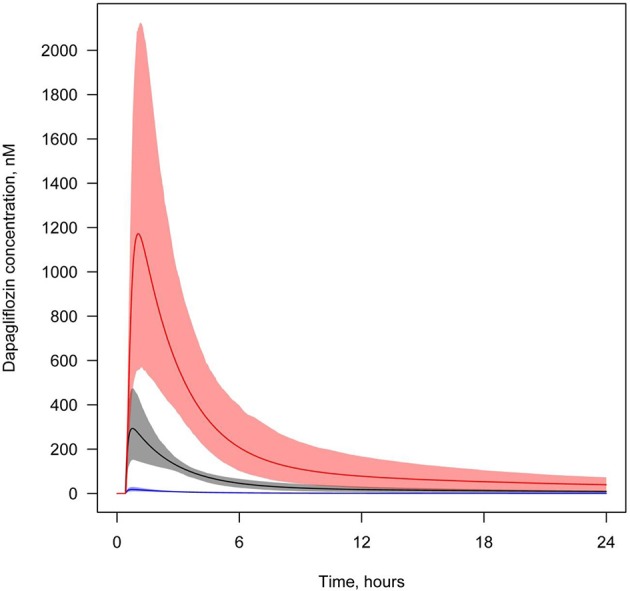
Concentration of dapagliflozin in plasma and the lumen of the kidney's proximal tubules. Dapagliflozin levels found in different compartments following simulation of a single administration of 10 mg. Colors of curves correspond to various compartments. Black—total plasma concentration; blue—unbound plasma concentration; red—concentration in lumen. Model simulations are presented with 95% confidence bands.