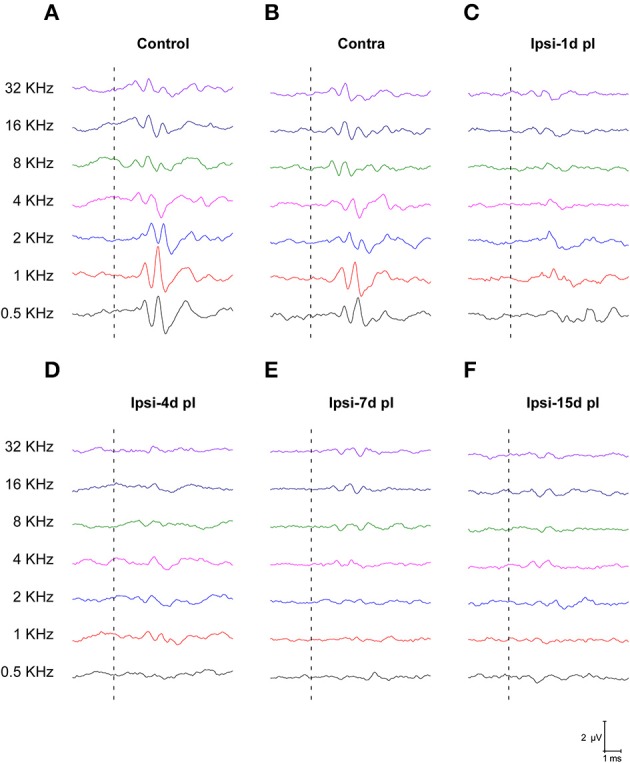
Figure 1.

Line graphs depicting ABR recordings at 80 dB SPL for all frequencies tested in control (A) and experimental animals following UCHL (B–F). In control animals (A) and in the contralateral side (B), ABR recordings show a normal wave pattern, which was characterized by positive peaks generated following the stimulus onset (dashed lines). However, post-lesion (pl) ABRs at all timepoints, showed reduction of the responses following stimulus onset (dashed lines) at all frequencies evaluated (C–F).
