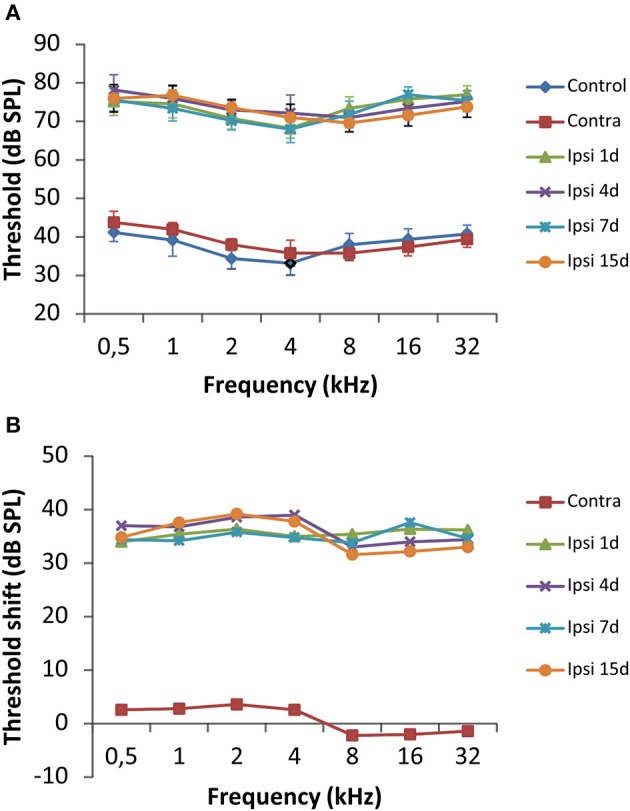
Figure 2.

Line graphs illustrating the effects of UCHL over the auditory thresholds at all frequencies tested. (A) There was a significant threshold elevation in the ipsilateral side at all timepoints after the UCHL in comparison with control animals and the contralateral side of deprived rats. (B) The threshold shift was of 30–40 dB SPL in comparison to the contralateral side and unoperated rats. The error bars indicate the standard errors of the mean.
