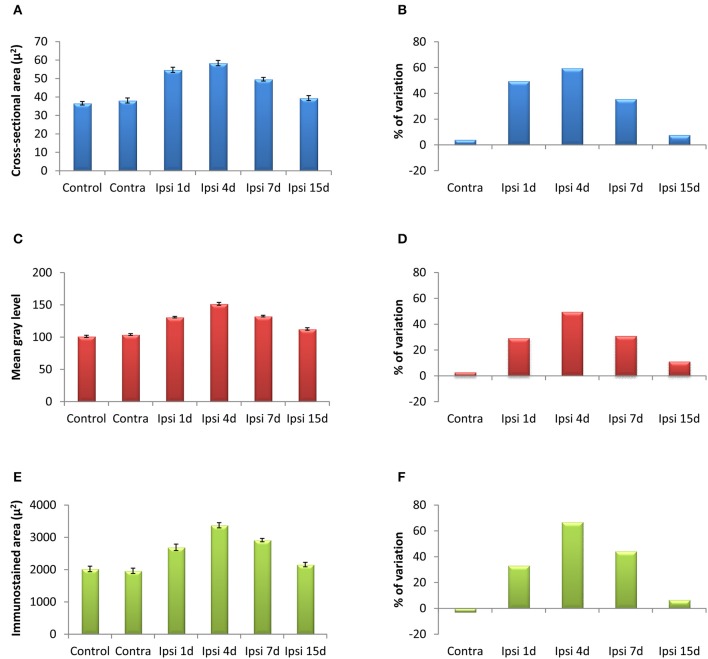
Figure 4.
Bar graphs showing the mean cross-sectional areas of Iba1 immunostained cells (A,B), the mean gray levels of the immunostaining (C,D) and the immunostained areas (E,F) in the AVCN of control and deprived animals. These three indexes were significantly increased at 1, 4, and 7 d but not at 15d after ossicle removal in comparison with the contralateral side and unoperated animals. The percentages of variation for each quantitative index are shown in B,D,F. The error bars indicate the standard errors of the mean.

