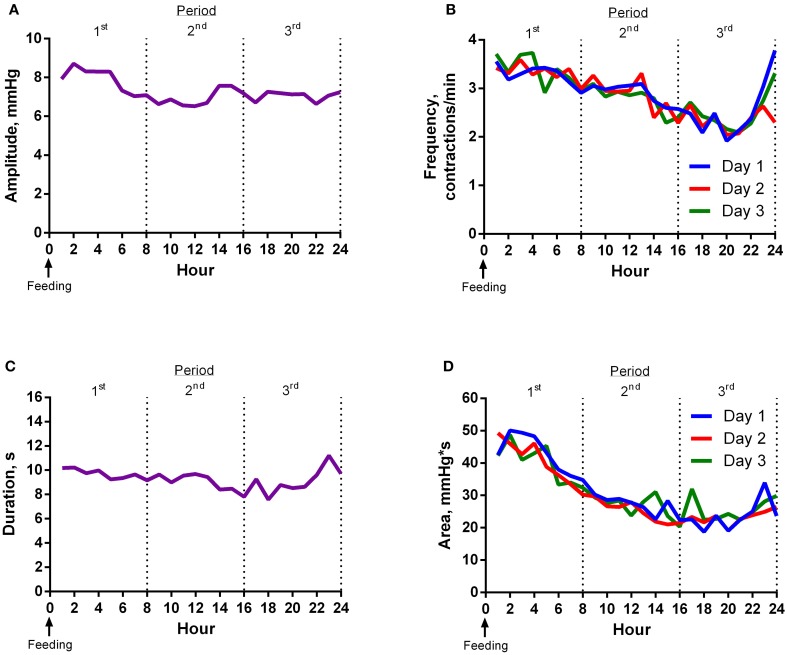
Figure 1.
Experiment 1 Results. (A) Mean contraction amplitude of steers (n = 8) for each hour relative to feeding. The mean contraction amplitude of the first 8 h period was higher (P < 0.01) than the second. The mean contraction amplitude of the second 8 h period was not different (P = 0.96) from the third. (B) Mean contraction frequency of steers (n = 8) for each hour relative to feeding. Mean contraction frequency of day 2 was lower (P = 0.03) than day 3. The mean contraction frequency of the first 8 h period was higher (P < 0.01) than the second. The mean contraction frequency of the second 8 h period was different (P < 0.01) from the third. Additionally, the average of the first and third 8 h periods was not different (P = 0.35) from the second. (C) Mean contraction duration of steers (n = 8) for each hour relative to feeding. The mean contraction duration of the first 8 h period was longer (P < 0.01) than the second. The mean contraction duration of the second 8 h period was not different (P = 0.34) from the third. (D) Mean contraction area of steers (n = 8) for each hour relative to feeding. Mean contraction area of day 1 was lower (P = 0.03) than day 3. The mean contraction area of the first 8 h period was greater (P < 0.01) than the second. The mean contraction area of the second 8 h period tended (P = 0.07) to be greater than the third.

