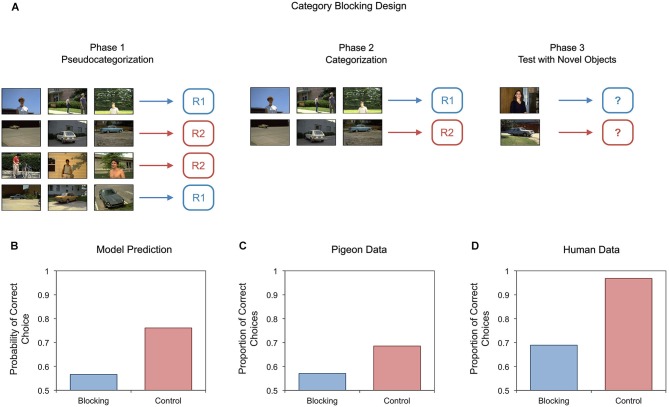
Figure 6.
Schematic diagram of an experiment on blocking of object category learning (A), together with our model’s predictions (B) and experimental results of studies with pigeons (C) and people (D). Bars in the bottom figures represent responding to novel test objects from the training categories during Phase 3.

