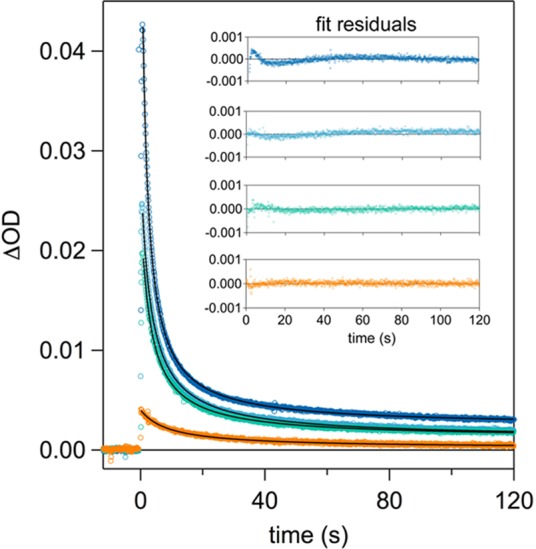
Figure 5.

TA kinetic traces recorded at 410 nm for α3Y at pH 5.5. All excitation pulses at 447.5 nm were 500 ms in duration, where neutral density filters of varying strengths were used to modulate the amount of light supplied to the sample. This gave a wide range of initial Y32–O• concentrations, specifically: 34 μM (dark blue), 21 μM (light blue), 16 μM (green), and 3 μM (orange). The inset of the plot shows residuals to a second-order fit for each trace.
