
Figure 1.
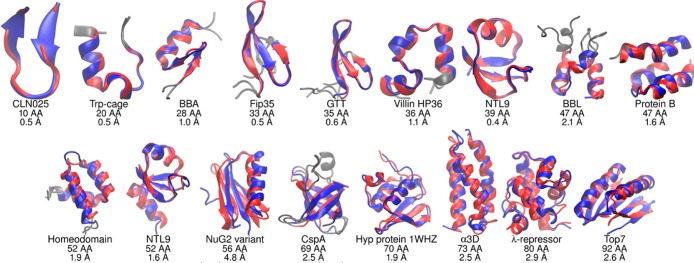
Comparison of structures based (red) on experiment and (blue) lowest RMSD in simulations started from extended conformations. Under each structure is shown the protein name, chain length, and Cα RMSD value (gray regions were poorly defined by experiment and are excluded, see text for details).