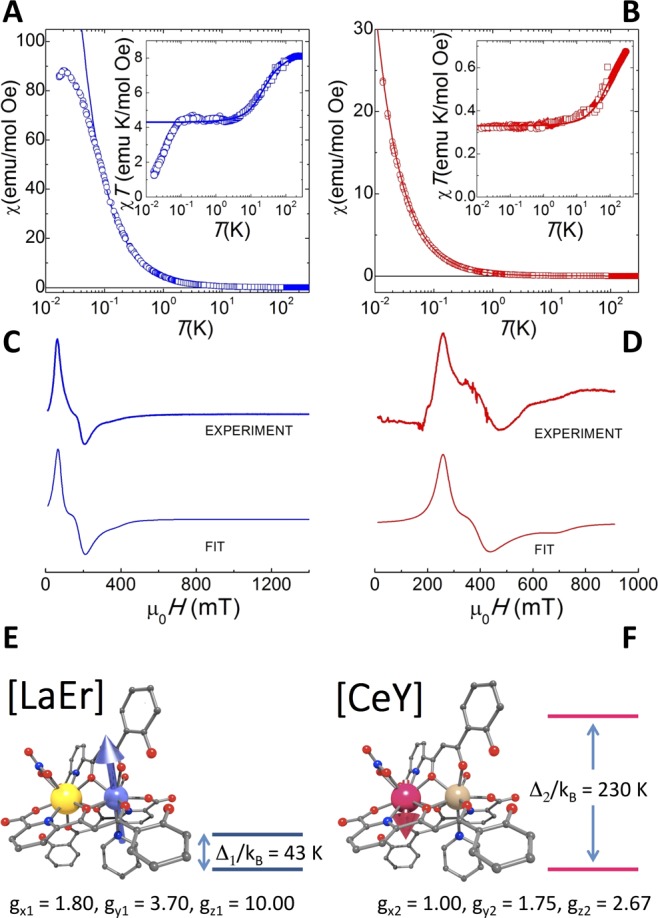
Figure 2.

Individual lanthanide spin qubits. (A and B) Temperature dependence of the equilibrium magnetic susceptibility of, respectively, [LaEr] (4) and [CeY] (5) molecular complexes. Open symbols represent zero-field ac susceptibility data recorded, at 1.5 Hz, with a microSQUID susceptometer (circles, ac field amplitude 0.01 Oe) and a commercial SQUID magnetometer (squares, ac field amplitude 4 Oe). Solid symbols are dc susceptibility data measured under a 1000 Oe applied magnetic field. The agreement between data measured by different techniques shows that they correspond to the linear response, i.e., to the zero-field susceptibility. The insets show the χT products. The solid lines are least-squares fits based on eq 2. (C and D) X-band continuous wave EPR spectra of 4 and 5, respectively. The fits are based on a spin-1/2 Hamiltonian (eq 1) describing the magnetic properties of the ground-state doublet, which defines each qubit basis. Panels E and F show both complexes and their low-energy magnetic level structures.
